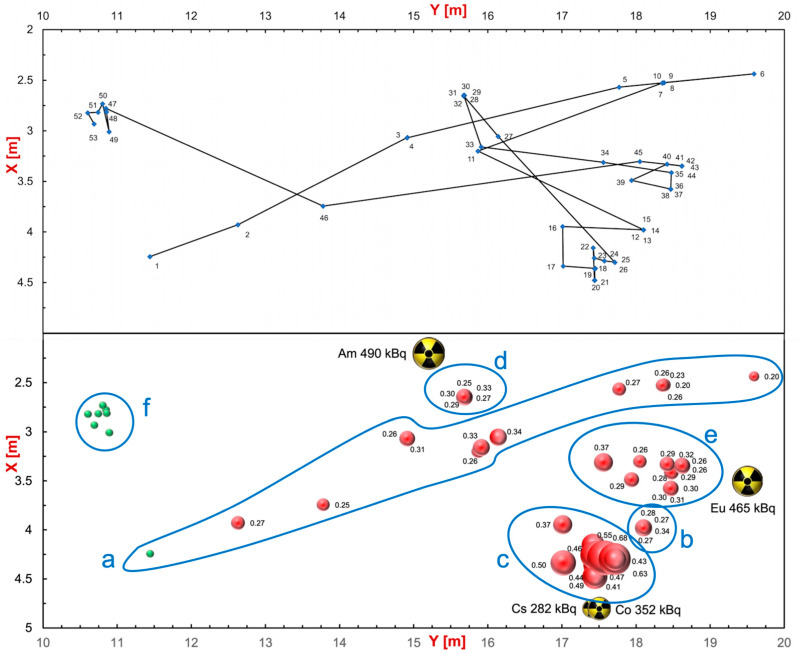
Figure 6.
Global summary of the gamma mission. (Top) The path followed by the UGV with the indication of the 53 positions. (Bottom) Bubble plot with the corresponding measured dose rates with numbers (in µSv/h) and bubble size. The indicated tags a–f correspond to the regions as listed in Table 1. The position and activity of the sources are also shown.

