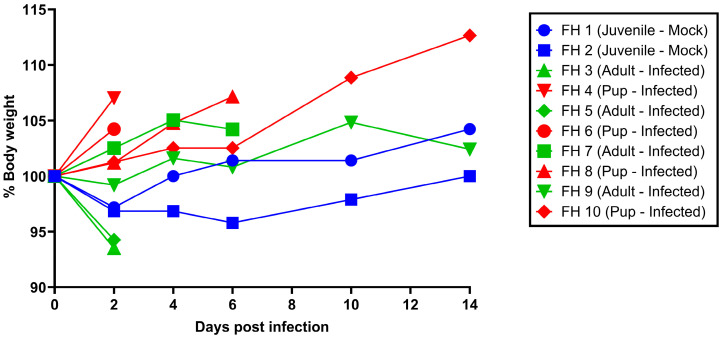
Figure 1.
Body weight curves of R. aegyptiacus bats following CedV challenge. Individual weight curves of each bat: Four adult bats (green) and their four unweaned pups (red) were intranasally inoculated with 8 × 10⁴ PFU/150 µL and monitored for 14 days post-infection. Two juvenile bats (blue) were kept as a mock-inoculated control. The graph depicts the body weight changes (%) relative to 0 days post-infection.

