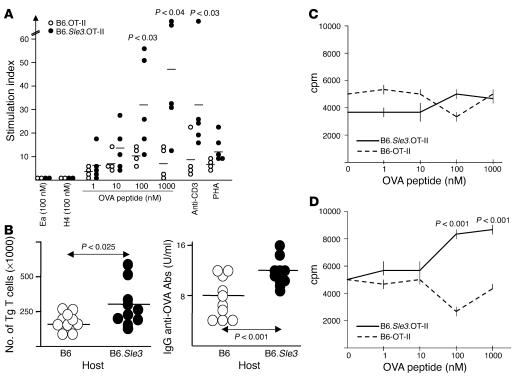
Figure 2.
Functional responsiveness of B6.Sle3.OT-II T cells. (A) B6.OT-II and B6.Sle3.OT-II splenocytes were cultured with various stimuli and assessed for proliferation. Stimulation index was cpmexperiment/cpmno-antigen. The cpmno-antigen values ranged from 2,000 to 5,000. Each dot represents an independent spleen sample. Horizontal bars indicate the respective group means. The data shown were reproduced in 2 additional studies (Supplemental Table 1 [supplemental material available online with this article; doi:10.1172/JCI23049DS1]). (B) B6.OT-II splenic T cells were transferred i.v. into 2-month-old B6 or B6.Sle3 mice on D0 and challenged with an immunogenic form of OVA on D1, as described in Methods. Seven days after transfer, the numbers of Tg T cells in the recipient spleens (left) and serum IgG anti-OVA levels (right) were assessed. Horizontal bars indicate group means. The displayed data were pooled from 2 independent studies using 5 mice per strain. (C) B6.OT-II and B6.Sle3.OT-II mice (n = 5 per group) were challenged with OVA323–339 in incomplete Freund’s adjuvant on D0; splenocytes were isolated on D5 and assessed for their proliferative response to OVA323–339. The vertical bars represent the SEM of triplicate cultures. Data shown are representative of 2 independent studies. Observed differences were not statistically significant. (D) B6.OT-II and B6.Sle3.OT-II mice (n = 5 mice per group) were challenged first with tolerogenic OVA on D0 and then with immunogenic OVA on D10 and examined as described in Methods. The vertical bars represent the SEM of triplicate cultures. In a second confirmatory study (data not shown), the fold difference in cpm between the 2 strain groups was 1.9 (P < 0.04, n = 4 each), at an OVA stimulation dose of 1,000 nM.

