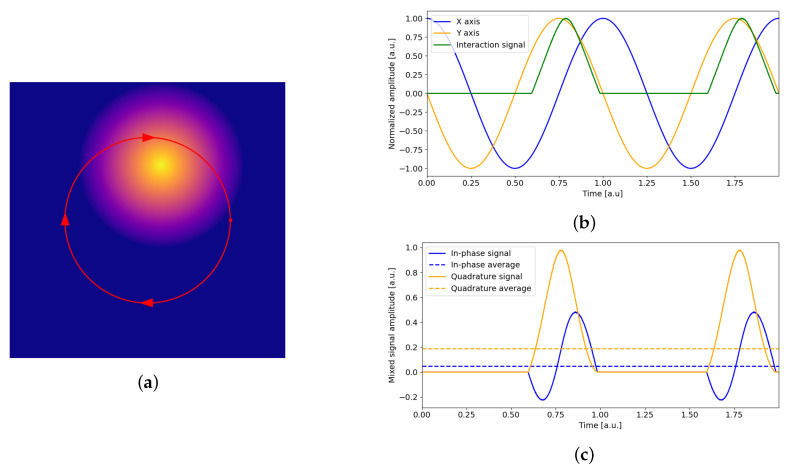
Figure 6.
(a) Visualization of the circular motion of the probe (red circle) near a protruding surface feature. (b) Visualization of the x- (blue) and y-signals (orange) used to obtain the circular motion shown in (a) and the resulting interaction signal along the circular path (green), here assumed to be proportional to the feature height. (c) Resulting in-phase and quadrature signals and their mean values after demodulation.

