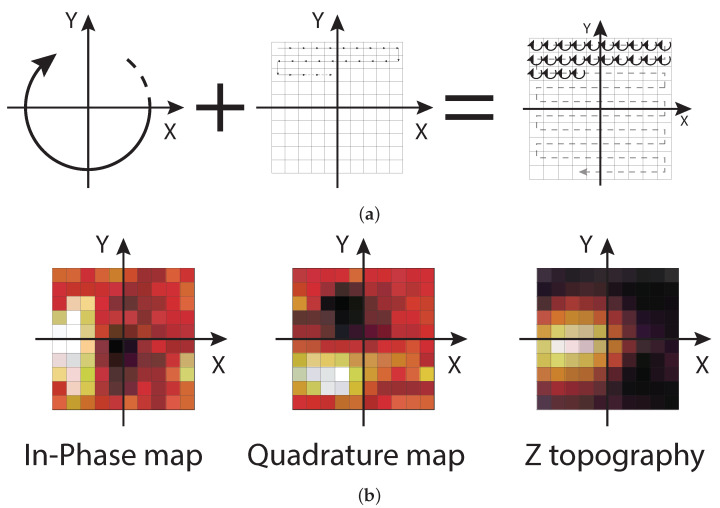
Figure 8.
(a) Representation of the scan movement used for error topography measurements resulting from the sum of a small, fast, circular movement and a slow conventional scan over the feature under investigation. (b) Example of in-phase and quadrature error maps resulting from the lock-in output and of the z-topography, resulting from the z-monitor signal input. Here, the lock-in phase has been correctly set as to align the x- and y-error signals with the physical scan axes (the heatmap indicates negative errors in black, positive errors in white).

