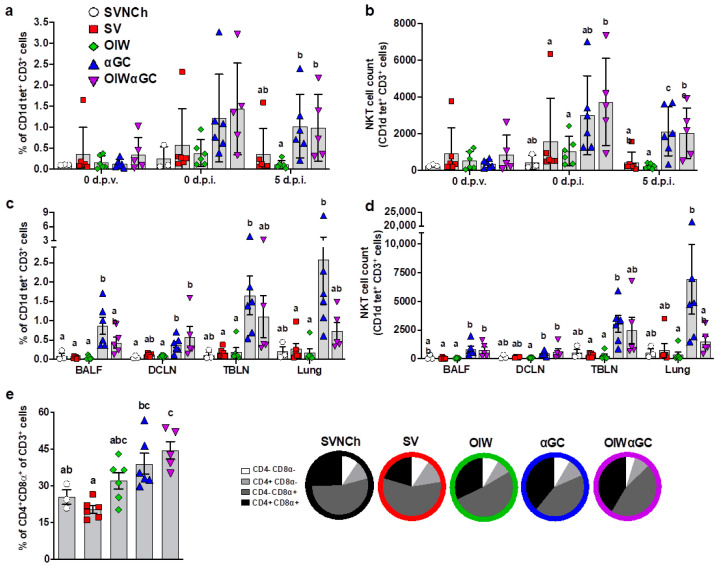
Figure 3.
Immune cell characterization. (a,b) iNKT cells as a proportion of peripheral blood CD3+ lymphocytes (a) and the total number of iNKT cells in 106 live cells at 0 d.p.v. and 0 and 5 d.p.i. (b). (c,d) iNKT cells in BALF, DCLN, TBLN, and lung tissue at 5 d.p.i. as a proportion of CD3+ lymphocytes (c) and the total number of iNKT cells (d). (e) Double-positive CD4+CD8α+ T cells as a proportion of total CD3+ cells in lung tissue at 5 d.p.i. Differences between treatment groups were determined by Tukey’s (a,b,e) or Dunn’s (c,d) multiple-comparisons test. A statistically significant difference between two groups is indicated by different letters. Data are presented as the mean ± SEM. Symbols represent individual pigs. SVNCh—sham vaccinated and not challenged, SV—sham vaccinated and challenged with CA04, αGC—vaccinated with MN08 mixed with 100 μg/kg of αGC and challenged with CA04, OIW—vaccinated with MN08 and the oil-in-water adjuvant Emulsigen-D and challenged with CA04, OIWαGC—vaccinated with a combination of OIW and αGC and challenged with CA04.

