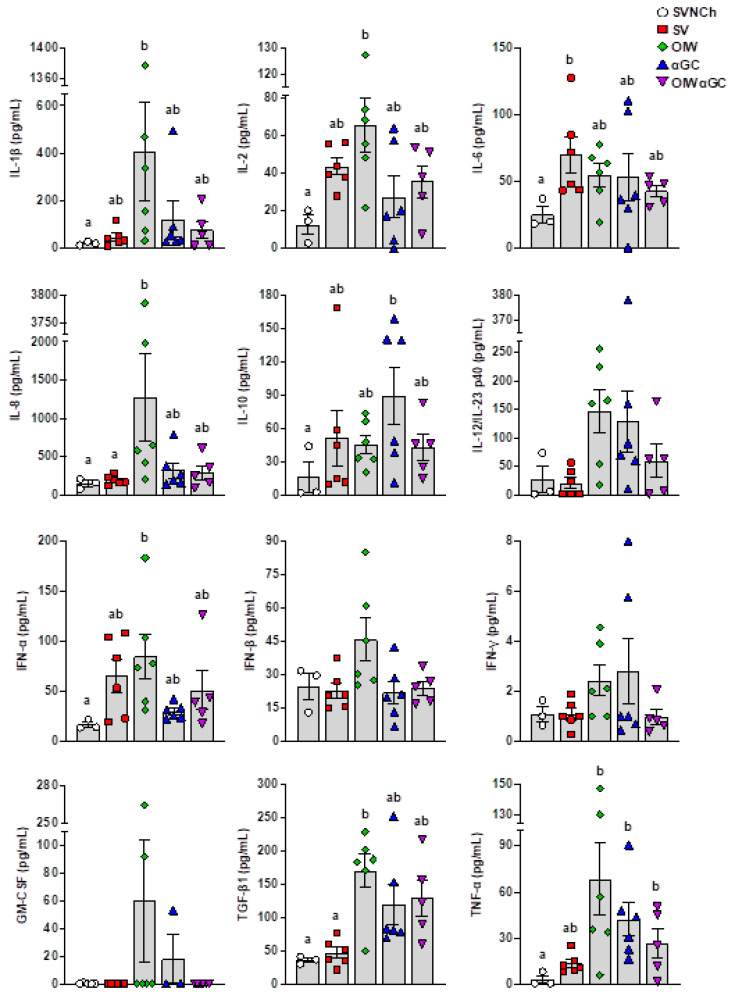
Figure 4.
Cytokine concentrations in bronchiolar lavage fluid collected at 5 d.p.i. Differences between treatment groups were determined by Tukey’s multiple-comparisons test. A statistically significant difference between two groups is indicated by different letters. Data are presented as the mean ± SEM. Symbols represent individual pigs. SVNCh—sham vaccinated and not challenged, SV—sham vaccinated and challenged with CA04, αGC—vaccinated with MN08 mixed with 100 μg/kg of αGC and challenged with CA04, OIW—vaccinated with MN08 and the oil-in-water adjuvant Emulsigen-D and challenged with CA04, OIWαGC—vaccinated with a combination of OIW and αGC and challenged with CA04.

