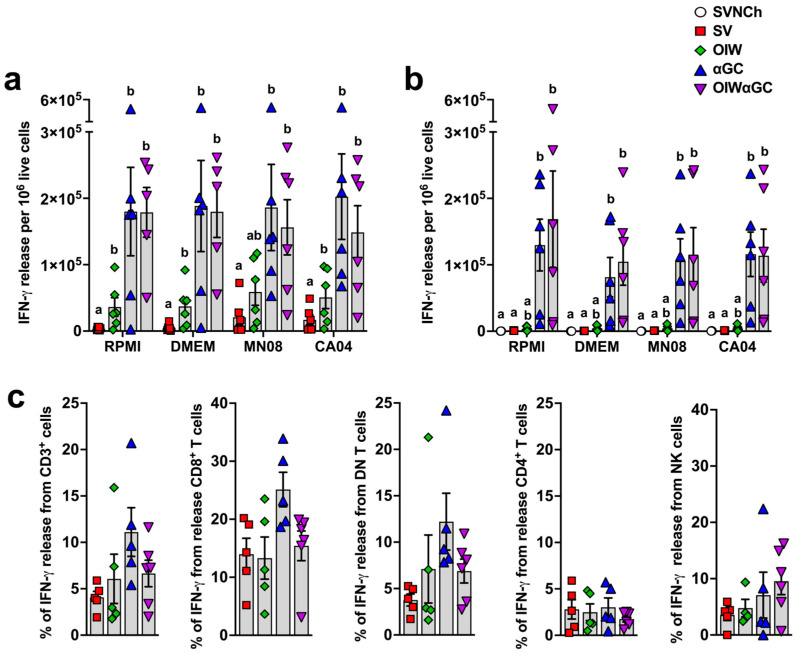
Figure 7.
Cellular responses measured by IFN-γ production. (a,b) IFN-γ production by PBMC (a) or by lung leukocytes collected at 5 d.p.i. (b) after 48 h incubation with RPMI, DMEM, or 0.1 MOI of MN08 or CA04. Results represent IFN-γ release per 1 × 10⁵ live cells after subtracting unstimulated wells. (c) Proportion of T cells and NK cells positive for IFN-γ in TBLN. TBLN from 5 d.p.i. where incubated for 5 h with or without phorbol myristate acetate (PMA) and ionomycin, membrane labeled with Abs against CD3, CD4, and CD8α, fixed and permeabilized, and intracellularly stained for IFN-γ. Data are presented as the mean ± SEM. Symbols represent individual pigs. SVNCh—sham vaccinated and not challenged, SV—sham vaccinated and challenged with CA04, αGC—vaccinated with MN08 mixed with 100 μg/kg of αGC and challenged with CA04, OIW—vaccinated with MN08 and the oil-in-water adjuvant Emulsigen-D and challenged with CA04, OIWαGC—vaccinated with a combination of OIW and αGC and challenged with CA04.

