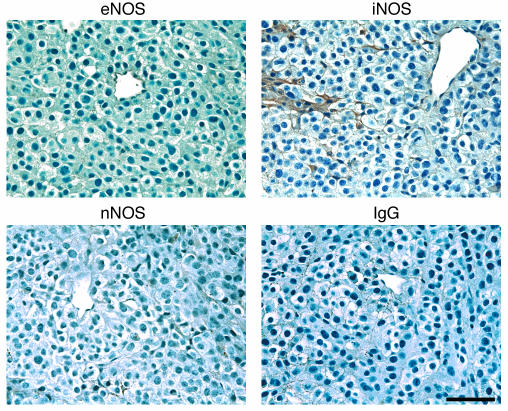
Figure 2.
Immunohistochemical analyses of the expression of NOS isoforms in B16F10 tumors grown in the cranial window. Note the expression of eNOS in endothelial cells (top left) and iNOS in some stromal cells (top right). Also note that there is no expression of nNOS (bottom left). Bottom right panel shows negative control using nonspecific mouse IgG staining. Scale bar: 100 μm.

