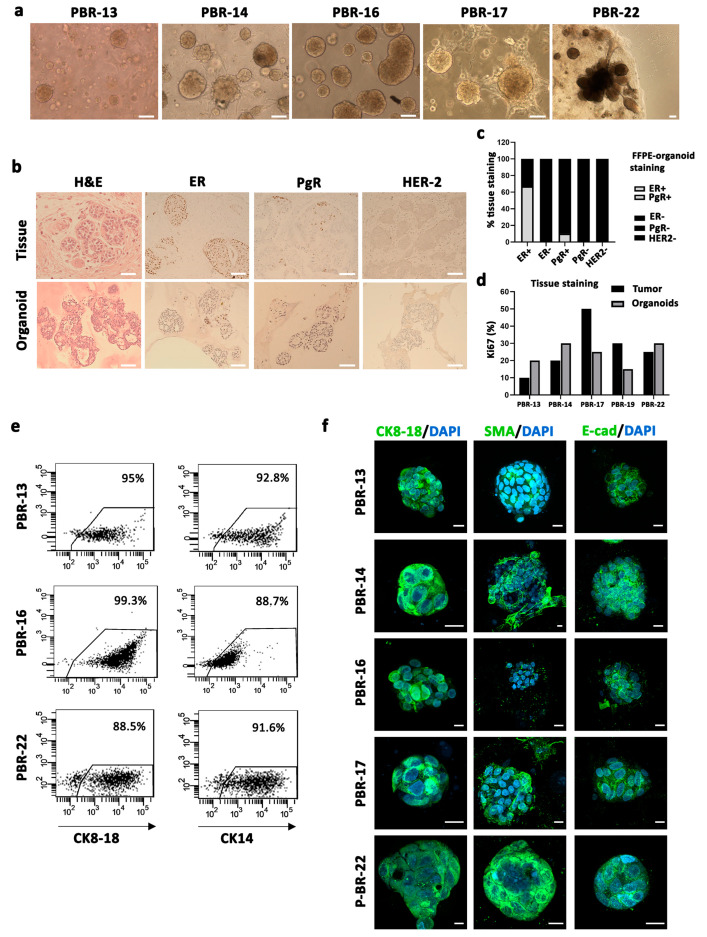
Figure 3.
Isolation and characterization of patient-derived breast cancer organoids (PDBCOs). (a) Representative bright-field images of 5 PDBCOs used for the study, showing different structures: cohesive and discohesive organoids, dense and solid (PBR-13, PBR-14, PBR-16, PBR-17), cohesive organoids, cystic and grape-like (P-BR-22). Scale bar, 100 µm. (b) Comparative histological and immunohistochemical images of BC tissues and derived organoid lines. Shown are representative examples of H&E staining and IHC of either HR or HER-2 status for PBR-17. Scale bar, 200 µm. (c) Stacked bar chart indicating the percentage of PDBCO lines found positive (grey) and negative (black) by IHC for the receptor expression grouped per original tumor receptor status. (d) Bar graph displaying proliferation rate percentage of PDBCOs and corresponding parental tumors as quantified by Ki67 immunohistochemical staining. (e) Representative dot-plot graphs showing CK14 and CK8-18 expression in PBR-13, PBR-16 and PBR-22 (f) CLSM analyses of PFA-fixed PDBCOs stained for CK8-18, SMA and E-cadherin (green); 4′-6-Diamidino-2-phenylindole (DAPI) was used to counterstain nuclei (light blue). Several (>50 organoids) were observed for each condition and representative images are shown. Scale bars, 10 µm.

