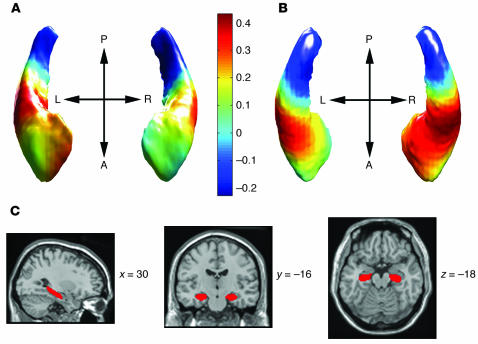
Figure 1.
Differences in shape between the HF in WS and normal controls. Shape change is rendered on an average (between groups) template of the HF. (A) Anterior view; (B) posterior view. Color scale correlates to the degree of deformation. Units are arbitrary. Negative values reflect relative local volume reduction in WS patients relative to controls. Positive values reflect local volume expansion in WS patients relative to controls. Double arrow marked A-P shows anterior-posterior direction. Double arrow marked L-R shows left-right direction. Significant findings (P < 0.05, corrected at the voxel level using small volume correction for the hippocampal ROI) were positive and greater than 0.3 and located in the mid/anterior section of the HF. (C) Same template shown superimposed on a representative single-subject MRI for orientation purposes. Coordinates x, y, and z are given in mm distance from the anterior commissure.

