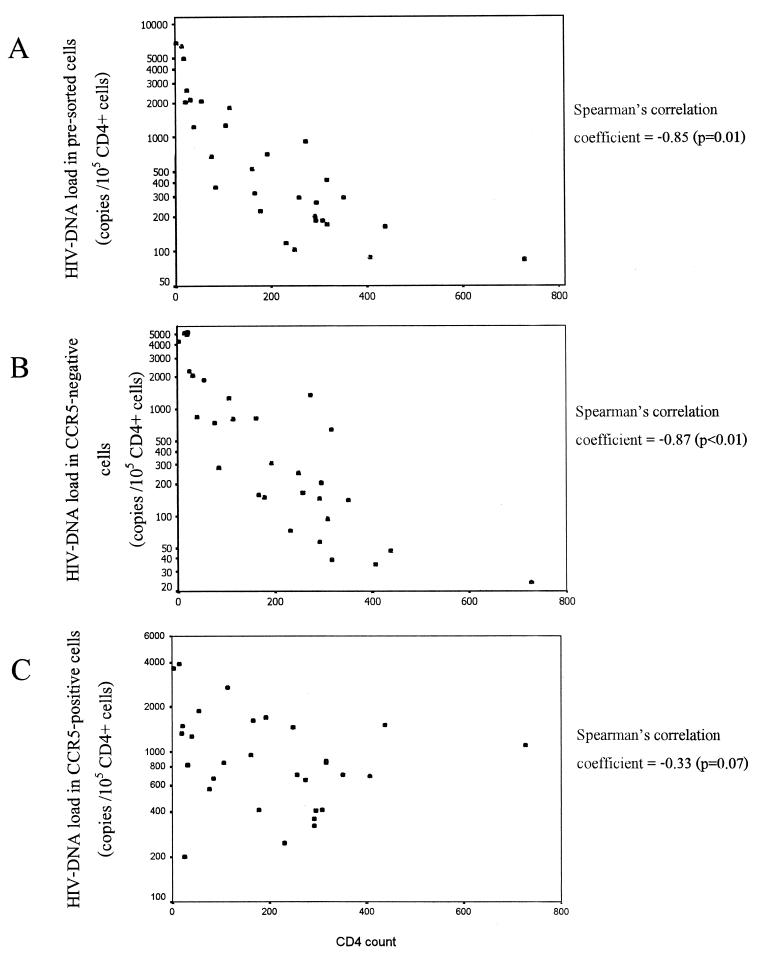
FIG. 3.
Scatter plots showing the correlation between CD4 count and total HIV DNA load (in log scale) in presorted non adherent cells (A), HIV DNA load in a CCR5-negative population (B), and HIV DNA load in a CCR5-positive population (C). Nonadherent cells were separated into CCR5-positive and -negative populations by immunomagnetic separation, and the HIV DNA content was measured by a gag quantitative competitive PCR.

