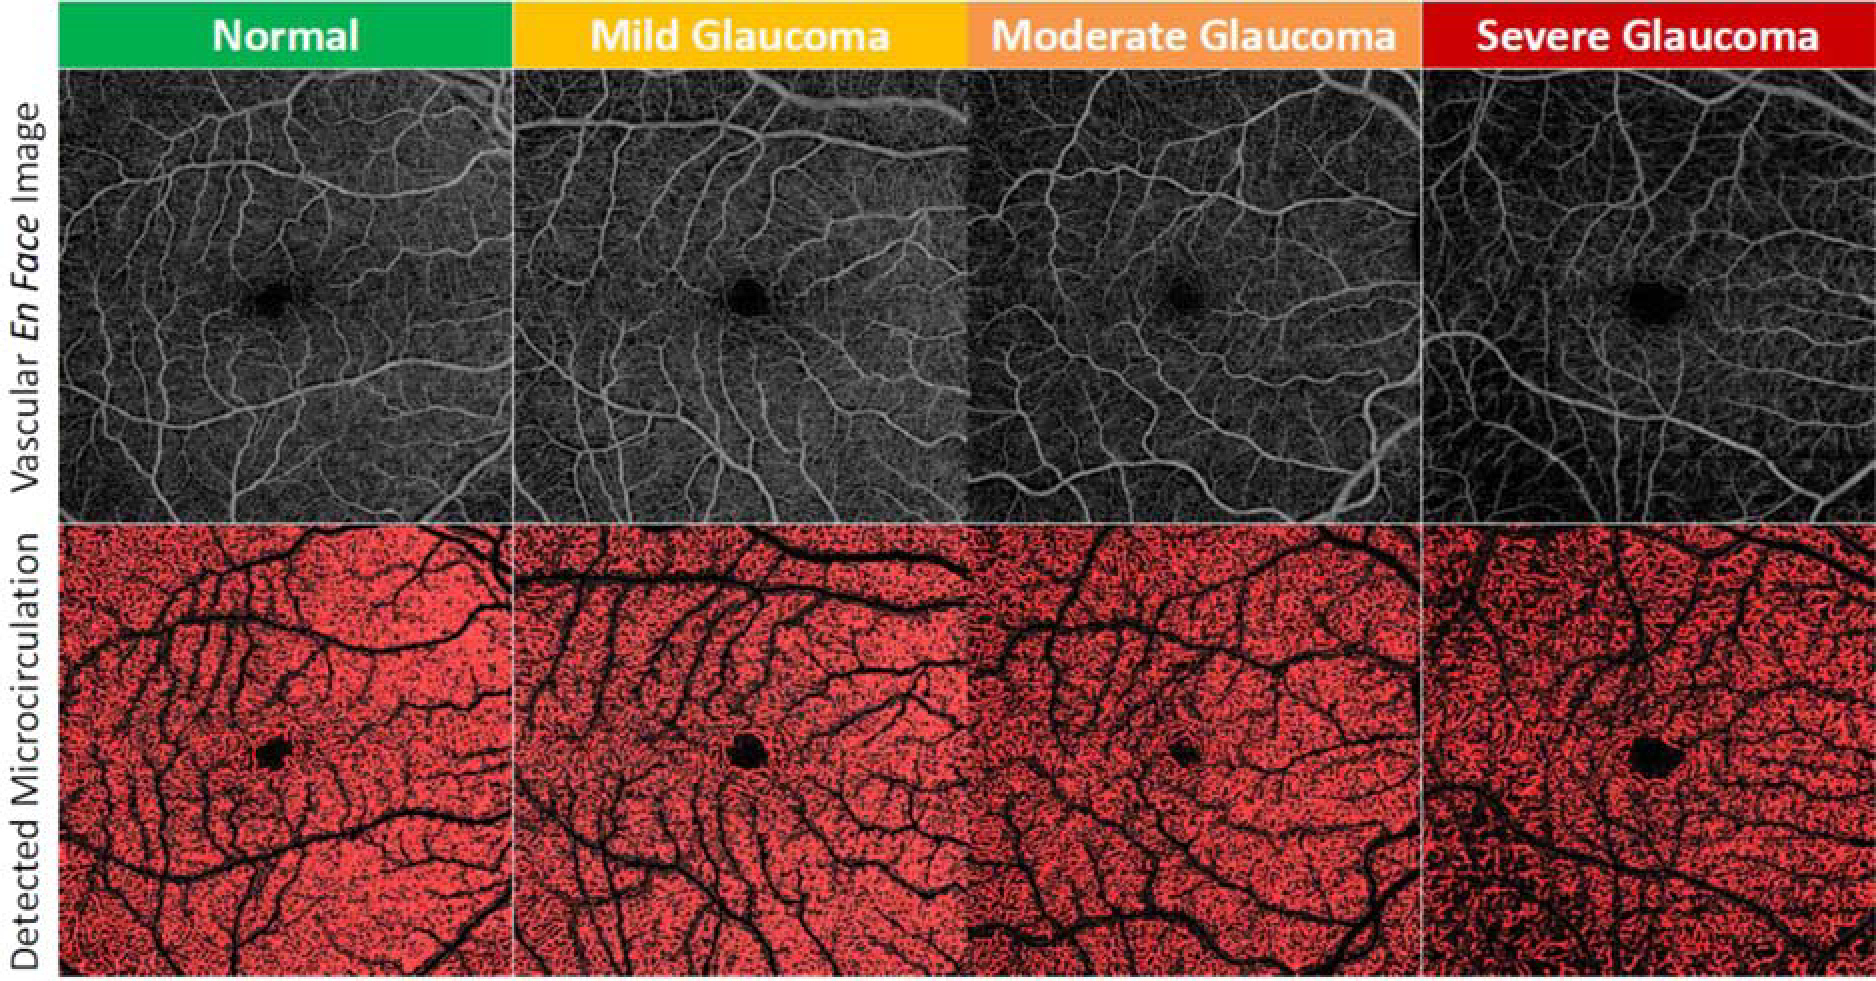
FIGURE 1.

Microvasculature in the ganglion cell and inner plexiform layer in the macular region in normal eyes and eyes with glaucoma with various disease severity (disease severity in this figure based on the visual field mean deviation system). Top layer: vascular en face images; bottom layer: vascular en face images with detected flow signal presented in red.
