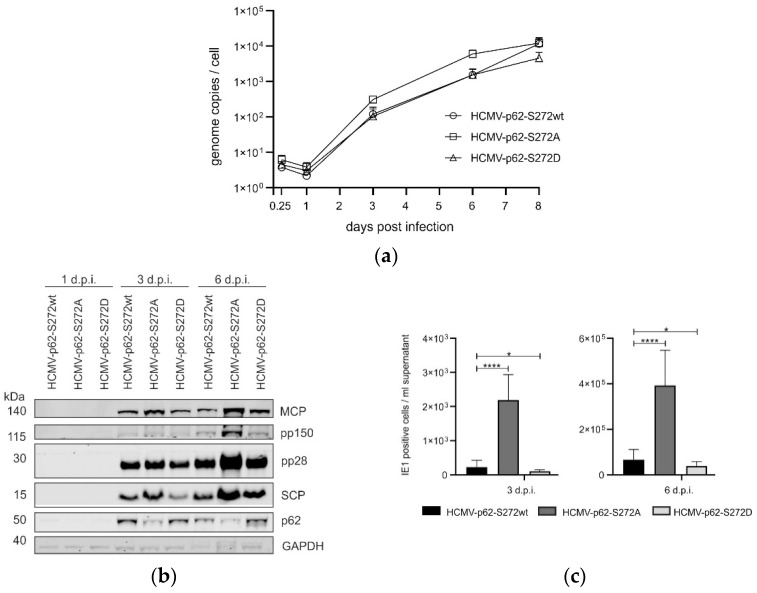
Figure 10.
Analysis of HCMV protein expression, genome replication and progeny production in dependence on p62-272 phosphorylation. HFF-ko-SQSTM1 cells were infected with HCMV-p62-S272wt, HCMV-p62-S272A, and HCMV-p62-S272D strains, respectively, using an m.o.i. of 0.1. Cells and cell culture supernatants were collected at the indicated time points. (a) Quantitative PCR analysis of HCMV genome replication. The mean values of three technical replicates from three independent experiments are shown for each virus and time point. The corresponding SD is displayed as error bars. (b) Western blot analysis of the intracellular levels of selected viral proteins, following infection. Cells were harvested at 1, 3, and 6 d.p.i., lysed, and probed by Western blot, using antibodies against HCMV proteins MCP, pp150, pp28 and SCP. The levels of GAPDH were used as loading control. One out of two individual experiments is shown. (c) Viral progeny release, which is measured by the IE1 assay. The graph represents mean values of eight technical replicates from three independent experiments for each virus and time point. The mean values and corresponding SD are represented in a bar chart with error bars. Statistical analysis was performed utilizing Brown–Forsythe and Welch one-way ANOVA (not significant (ns): p > 0.05; *: p < 0.05. ****: p < 0.0001).

