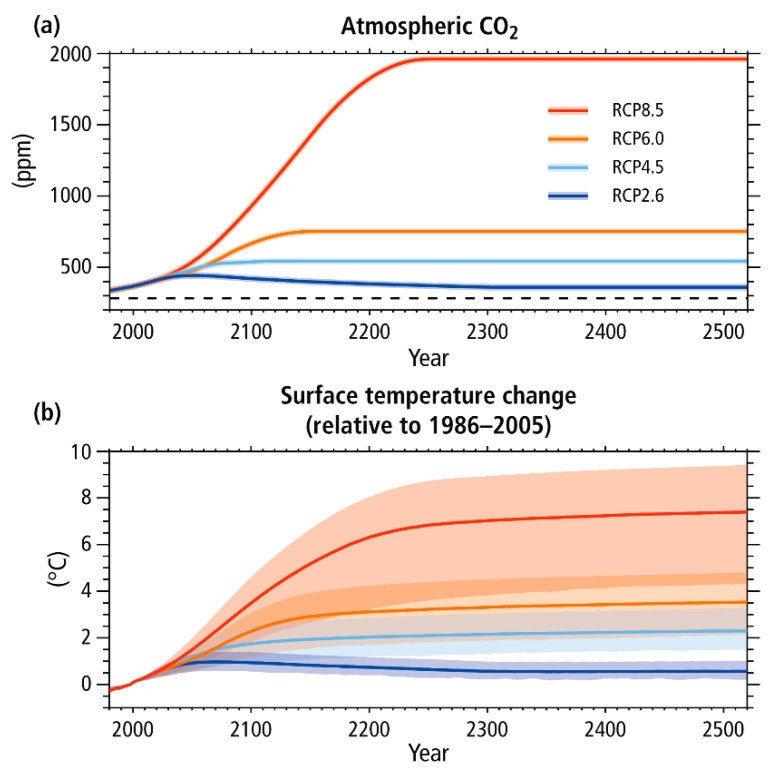
Figure 1.
Temperature variation scenarios for the next 100 years [7], where RCP is ‘Representative Concentration Pathway’. (a) represents CO2 concentration scenarios and (b) represents global temperature increase scenarios. The dashed line indicates pre-industrial CO2 concentration.

