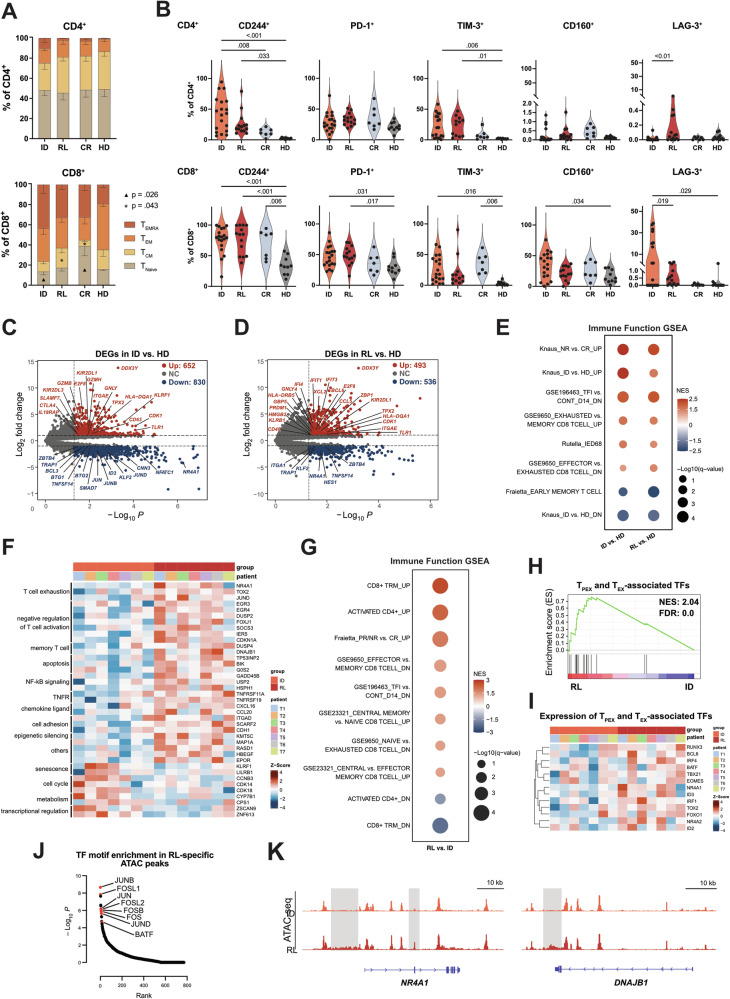
Fig. 1. Bone marrow T cells at the time of ID and RL display a phenotypic and transcriptional profile of dysfunction.
A Proportions of naive (TNaive, CD45RA+CCR7+), central memory (TCM, CD45RA−CCR7+), effector memory (TEM, CD45RA−CCR7−), and terminal effector (TEMRA, CD45RA+CCR7−) T cells within the CD4+, and CD8+ compartments. B Frequency of BM CD4+ (top row) and CD8+ (bottom row) T cells positive for inhibitory receptors at ID (n = 19), RL (n = 14), CR (n = 7), and in HDs (n = 10). C Volcano plot of DEGs at ID (n = 7) vs. HDs (n = 2). Significantly upregulated (red) and downregulated (blue) genes at ID are highlighted (log2FC > 1 or < −1; P < 0.05). Selected genes are labeled. D Volcano plot of DEGs at RL (n = 7) vs. HDs (n = 2). E GSEA for gene sets associated with immune function using published gene sets derived from MSigDB or custom gene sets. GSEA statistics are provided in Supplementary Table 3. F Heatmap demonstrating selected DEGs at RL compared to ID. G GSEA in RL vs. ID T cells for gene sets associated with T-cell populations and immune function from MSigDB and published data sets (details on the gene sets are provided in the Supplementary Methods). GSEA statistics are included in Supplementary Table 6. H GSEA in RL vs. ID T cells for TFs related to TPEX and TEX. I Heatmap showing the expression of top hits, from the analysis in panel H, in ID and RL patients. J TF motifs enriched in RL-specific ATAC peaks. Significant motifs are labeled and highlighted in red. K ATAC-seq tracks of selected genes significantly upregulated in RL vs. ID T cells. BM bone marrow, CR complete remission, DEG differentially expressed gene, GSEA gene set enrichment analysis, HD healthy donor, ID initial diagnosis, RL relapse, TF transcription factor. All plots represent the mean ± SEM. One-way ANOVA was used to calculate P values.

