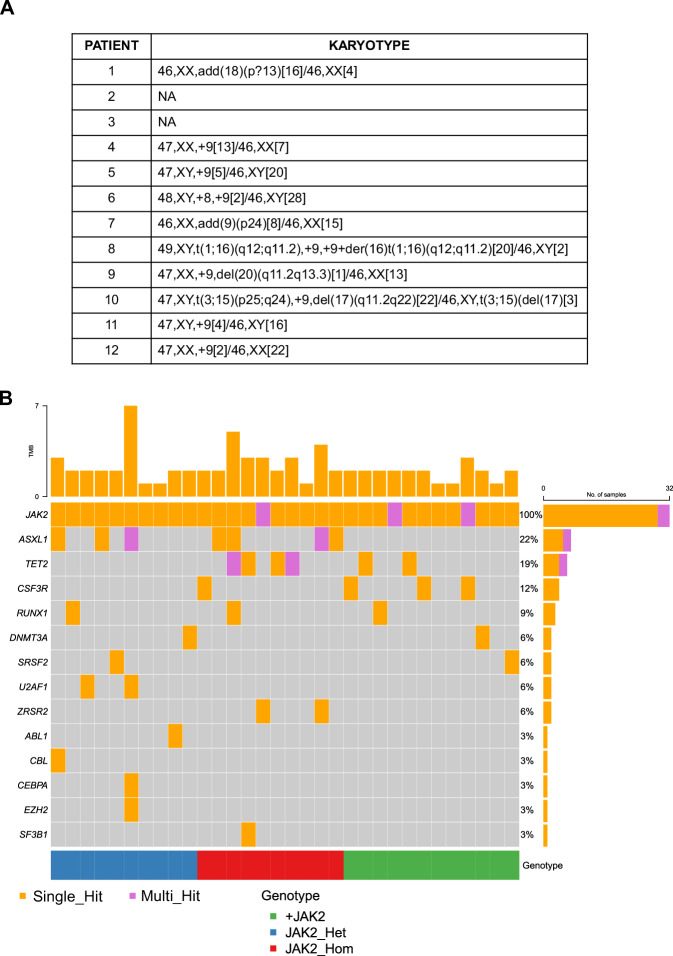
Fig. 1. Description of the genomic asset of the analyzed patients’ cohort.
A Karyotype of the +9p MPN patients (n = 12) at diagnosis. B Waterfall plot detailing the mutational profile of the entire cohort inferred from NGS data. Patients are split according to JAK2V617F allele frequency and/or JAK2 copy number (blue = normal copy number and heterozygous JAK2V617F, 20% < VAF < 50%, n = 10; red = normal copy number and homozygous JAK2V617F, VAF > 50%, n = 10; green = JAK2 mutation and trisomy, n = 12). For each patient, the mutational asset of a specific gene is reported as an orange box if the gene harbors a single variant or a purple box if multiple variants within the same gene are detected.

