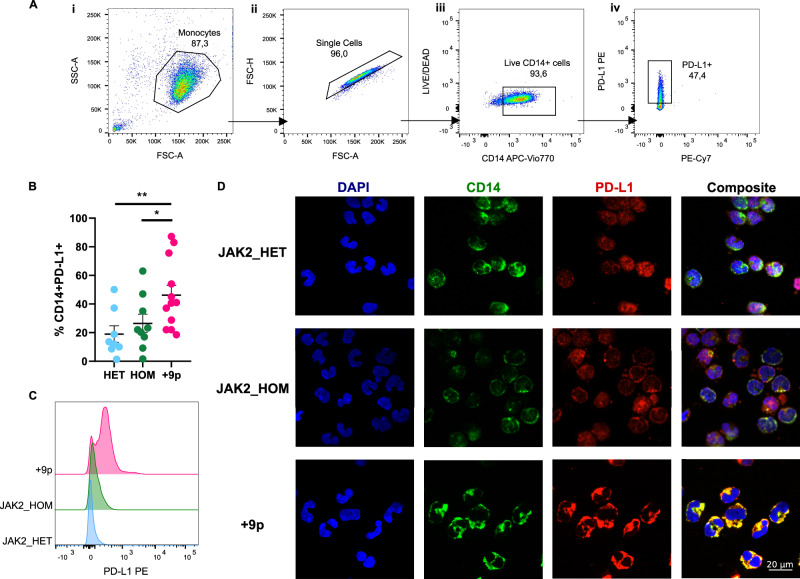
Fig. 6. PD-L1 expression on monocytes of JAK2-mutated MF patients.
A Representative gating strategy used to quantify CD14 + PD-L1+ cells. (i) Side scatter area (SSC-A) vs forward scatter area (FSC-A) plot, showing the monocyte gate. (ii) Forward scatter height (FSC-H) vs forward scatter area (FSC-A) plot defining the single cell gate. (iii) LIVE/DEAD vs CD14 APC-Vio770 plot gating for live cells. (iv) PD-L1 PE vs PE-Cy7 plot depicting PD-L1+ cell gate. B Percentage of circulating CD14 + PD-L1+ cells in patients. Results are represented as means ± SEM. C Representative histograms for flow cytometry detection of PD-L1 staining in CD14+cells from HET (n = 8), HOM (n = 9) and +9p (n = 12) patients. D PD-L1 cellular localization in monocytes of JAK2-mutated MPN patients. The figure displays representative confocal microscopy images of immunofluorescence staining performed on monocytes coming from a JAK2_HET patient, a JAK2_HOM patient, and a + 9p patient. In every panel, the image on the far right is a merge of the other 3 images. Cells were labeled with anti-CD14 antibody (green fluorescence) and with anti-PD-L1 antibody (red fluorescence); nuclear counterstaining was performed with DAPI (blue fluorescence). HD: healthy donors; HET: JAK2-mutated heterozygous patients; HOM: JAK2-mutated homozygous patients; +9p: JAK2-mutated patients with 9p trisomy. *p < 0.05; **p < 0.01.

