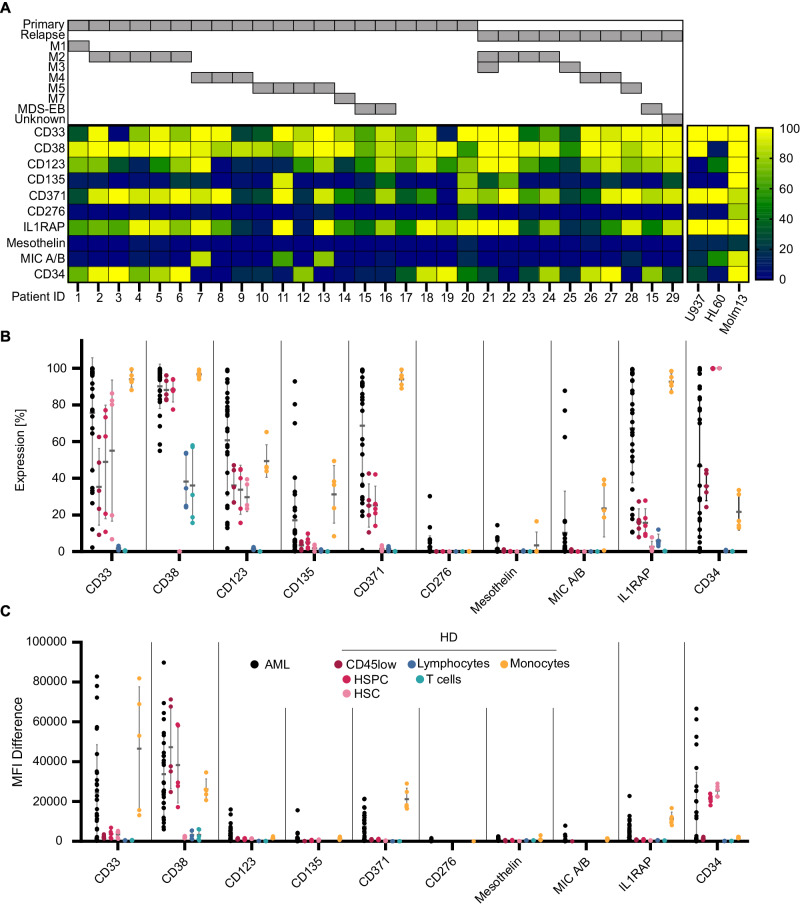
Fig. 1. Expression of target antigens in pediatric AML and healthy bone marrow.
A Heatmap visualizing the percentage of leukemic blasts, defined as CD45dim cells within the BM of pediatric AML patients (n = 30), expressing the target antigens CD33, CD38, CD123, CD135, CD371, CD276, IL1RAP, Mesothelin, or MIC A/B as well as CD34, analyzed by flow cytometry. Patients are grouped by primary disease vs. relapse as well as FAB classification/MDS-EB. Target expression of the used AML cell lines are visualized as heatmap next to patient data (right). Comparison of target antigen expression between AML blasts and major cell populations (defined as follows: HSC (CD45dim/CD34high/CD38low), HSPC (CD45dim/CD34high/CD38high), lymphocytes (CD45high/SSClow), T cells (CD45high/SSClow/CD3high), and monocytes (CD45high/SSCmedian)) in bone marrow from healthy donors (n = 5). In B the percentage of antigen-positive cells is provided; in C the mean fluorescence intensity difference (MFID). Each data point represents an individual patient or heathy donor, and horizontal lines represent the mean value ± standard deviation (SD).

