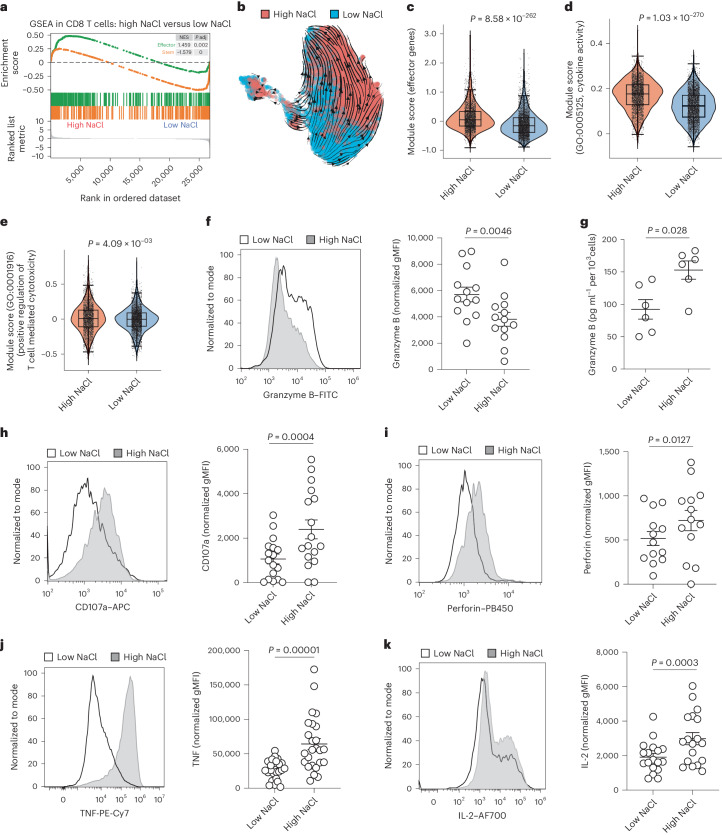
Fig. 3. NaCl enhances CD8+ T cell effector function and cytotoxicity.
a, GSEA for effector- and stemness-associated genes was performed after a transcriptomic comparison of bulk human CD8+CD45RA− T cells stimulated with CD3 and CD28 mAbs for 5 d under high and low NaCl conditions. b, RNA velocity analysis after scRNA-seq of human CD8+CD45RA− T cells stimulated with CD3 and CD28 mAbs for 3 d under high and low NaCl conditions. The velocities are shown in UMAP embedding. Cells are color coded according to the treatment condition as indicated. c–e, ScRNA-seq and analysis of the module scores of the indicated gene sets (c, effector genes; d, cytokine activity; e, positive regulation of T cell mediated cytotoxicity) for human CD8+CD45RA− T cells stimulated with CD3 and CD28 mAbs for 3 d under high and low NaCl conditions (n = 1; Wilcoxon’s rank-sum test). f, Intracellular cytokine staining and flow cytometric analysis of human CD8+CD45RA− memory T cells after stimulation for 5 d with CD3 and CD28 mAbs under high and low NaCl conditions. Left, representative experiment; right, cumulative data (n = 13; mean ± s.e.m., two-tailed, paired Student’s t-test). g, ELISA of cell culture supernatants from human CD8+ memory T cells stimulated for 5 d with CD3 and CD28 mAbs (n = 6; mean ± s.e.m., two-tailed, paired Student’s t-test). h, Flow cytometric analysis of human CD8+CD45RA− T cells performed after stimulation for 5 d with CD3 and CD28 mAbs under high and low NaCl conditions. Left, representative experiment; right, cumulative data. Data present the mean ± s.e.m. (n = 17; two-tailed, paired Student’s t-test). i–k, Intracellular cytokine staining and flow cytometric analysis (i, perforin; j, TNF; k, IL-2) of human CD8+CD45RA− T cells after stimulation for 5 d with CD3 and CD28 mAbs under high and low NaCl conditions and restimulation with PMA/ionomycin for 5 h. Left, representative experiment; right, cumulative data. Data present the mean ± s.e.m. (n = 25 (j), n = 18 (k); two-tailed, paired Student’s t-test).

