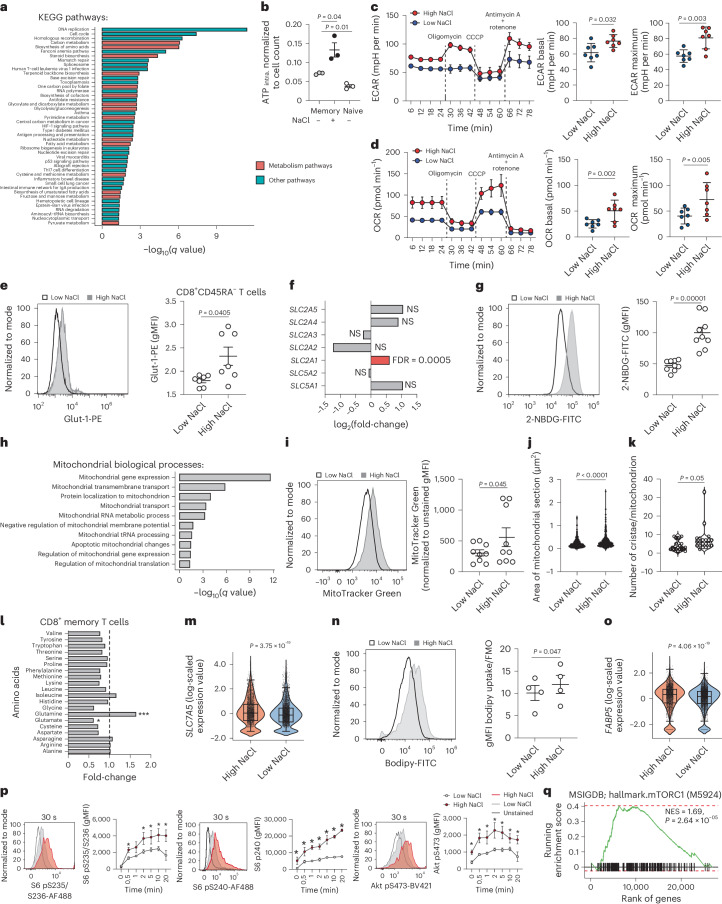
Fig. 4. NaCl potentiates the metabolic fitness of CD8+ T cells.
a, Enrichment by overrepresentation analysis for all 45 upregulated KEGG pathways (with Benjamini–Hochberg-adjusted q value ≤ 0.05) using significantly upregulated DEGs (P ≤ 0.05, log2(fold-change) ≥ 0.5) from the bulk transcriptomic comparison of human CD8+CD45RA− T cells stimulated for 5 d with CD3 and CD28 mAbs under high and low NaCl conditions. b, Luminometric assessment of ATP production in human CD8+CD45RA+ and CD8+CD45RA− cells, which were stimulated as described in a, normalized to ATP per cell (n = 3; mean ± s.e.m., two-tailed, paired Student’s t-test). c,d, Real-time analysis of the ECAR (c) and OCR (d) by human CD8+CD45RA− T cells using a Seahorse Extracellular Flux Analyzer. The dotted lines show the time point of addition of the indicated substances. Left, representative experiment with technical replicates; right, cumulative quantification with individual healthy donors (n = 7; mean ± s.e.m. two-tailed, paired Student’s t-test). e,g,i,n, Flow cytometric analysis of human CD8+CD45RA− T cells. Left, representative experiment; right, cumulative quantification (n = 7 (e), n = 9 (g), n = 9 (i), n = 4 (n); mean ± s.e.m., two-tailed, paired Student’s t-test). f, Expression of the indicated genes encoding glucose transporters in a transcriptomic comparison of bulk human CD8+CD45RA− T cells stimulated for 5 d with CD3 and CD28 mAbs under high and low NaCl conditions (n = 3). h, Significantly enriched terms of GO-annotated, mitochondrial biological processes after overrepresentation analysis of upregulated genes from the bulk transcriptomic comparison of human CD8+CD45RA− T cells stimulated as in a. The q values show P-value adjustment for multiple-test correction. Term redundancy was reduced using REVIGO (http://revigo.irb.hr, similarity parameter = 0.5). j,k, Transmission electron microscopy, number of mitochondria (j, n = 632 for low NaCl, 373 for high NaCl conditions) and cristae per mitochondrion (k, n = 18 for low NaCl, 21 for high NaCl) (two-tailed, unpaired Student’s t-test). The data represent two independent experiments. l, Nontargeted metabolic profiling (metabolome analysis) of CD8+CD45RA− T cells stimulated as in a (n = 4 individual blood donors (matched samples); one-way ANOVA). m,o, ScRNA-seq analysis of cells cultured as in a (m, SLC7A5; o, FABP5) one biological replicate (Wilcoxon’s rank-sum test). p, Phospho-flow analysis of CD8+CD45RA− T cells cells stimulated as in a after TCR crosslinking for the indicated time points (n = 3; mean ± s.e.m., two-way ANOVA with uncorrected Fisher’s LSD; *P < 0.05). q, Preranked GSEA. One-tailed permutation test for positive enrichment is based on an adaptive multilevel split Monte Carlo scheme (R package FGSEA).

