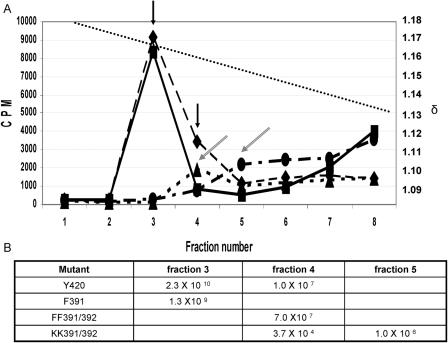
FIG. 8.
Isopycnic sedimentation and analysis of wild-type virus and endodomain mutant virus particles grown in BHK cells. Panel A is a graph of the sedimentation profile of mutants and wild-type virus through potassium tartrate as detailed in Materials and Methods. Wild-type virus (♦, black arrow) produced a peak of virus in fraction 3, displaying a small shoulder at fraction 4 (black arrow). The F391 mutant (▪) also gave a virus peak at fraction 3, similar to that of wild-type virus, without the virus shoulder at fraction 4. The FF391/392 virus peak (▴, gray arrow) is seen in fraction 4 cosedimenting with the wild-type virus shoulder. The mutant virus KK391/392 (•, gray arrow) displayed the lowest density, forming a peak in fraction 5. In panel B are shown the viruses from panel A correlating the peak of labeled virus from the gradient with virus infectivity. Peak infectivity for wild-type virus (♦) corresponds to the radiolabeled peak of virus (2.3 × 10¹⁰ PFU/ml) in fraction 3, with the shoulder at fraction 4 (1.0 × 10⁷ PFU/ml). The peak virus fraction for the mutant F391 (▪), 1.3 × 10⁹ PFU/ml, corresponded with that of the wild-type virus infectivity peak in fraction 3. The FF391/392 mutant also gave a peak infectivity titer (7.0 × 10⁷ PFU/ml) in the same fraction, fraction 4, as the radioactively labeled Y420 shoulder shown in panel A. The KK391/392 mutant displayed a broad peak of infectivity beginning with fraction 4 (3.7 × 10⁴ PFU/ml), with peak infectivity seen in fraction 5 (1.0 × 10⁶ PFU/ml) compared to the peak of labeled (A) Y420. Purified viruses from panel A were used for the negative stains seen in all figures.

