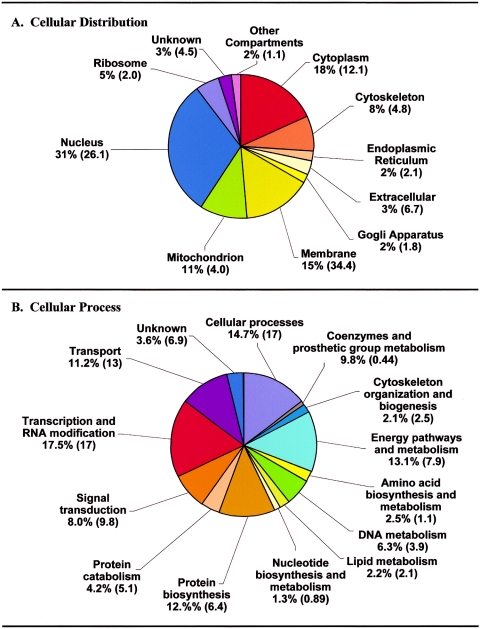
FIG. 3.
Graphic representation of the distribution of detected proteins from the global Huh-7.5 HCV replicon-positive sample by various cellular classifications. (A) Categorization was based upon GO identification numbers corresponding to cellular component, with approximately 56% of the proteins categorized. (B) Categorization was based upon GO identification numbers corresponding to cellular process, with approximately 55% of the proteins categorized. Values in parenthesis represent the percentage of all IPI Human Database GO identifications for comparison. Results were similar for the Huh-7.5 HCV replicon-negative cell samples.

