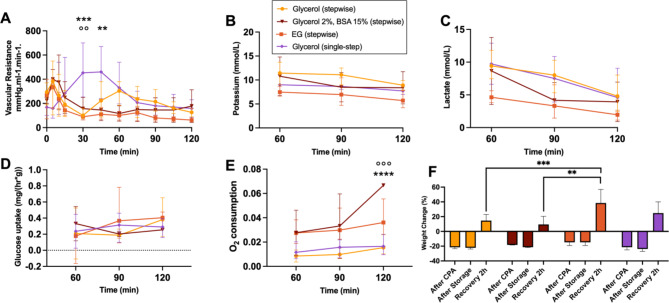
Fig. 6.
Perfusion parameters during the recovery phase. (A) Vascular resistance decreased faster in the stepwise groups (B) Potassium and (C) lactate level decreased over the course of recovery in all groups. (D) Glucose uptake showed an increase in the stepwise Glycerol 5% and EG group, with no significance. (E) Oxygen consumption was highest in the stepwise Glycerol 5% BSA15% group at 90 min compared to the single-step group (°) and the stepwise Glycerol 5% group (*). (F) Initial weight is equivalent to 0%. Weight gain at the end of the recovery phase was highest in the stepwise EG and single-step Glycerol group. **/°° p ≤ 0.0021; ***/°°° p ≤ 0.0002; **** p ≤ 0.0001.

