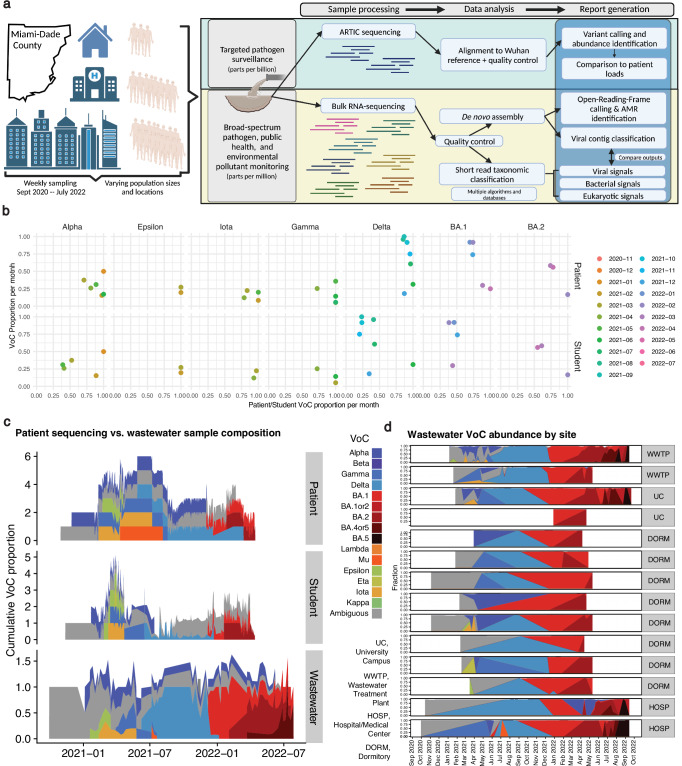
Fig. 1. Overview of approach and targeted sequencing of SARS-CoV-2.
a Samples were taken at (on average) weekly intervals between 2020 and 2022 from 34 sites within Miami-Dade County. Samples were sequenced with targeted ARTIC sequencing to measure SARS-CoV-2 abundance and bulk RNA sequencing to ascertain the broader microbial community. A variety of algorithms and analytic approaches were employed to identify and compare the taxonomic and functional profiles of each site across time and space, with the end result being a systematically characterized dataset with comparisons to clinical data to provide information relevant to public health surveillance showing the evolution of variants over space and time. b The monthly VoC proportions across datasets. Point color corresponds to the month. X-axis is the proportion of samples annotated as a given VoC for patient or student samples (derived from individual tests). Y-axis is the average variant abundance in targeted wastewater sequencing. c An additional, density-plot-based, view of all variants in wastewater vs patient/student cohorts over time. Colors correspond to different variants as defined in the legend between (c) and (d); this legend is relevant to both panels. d The variation in wastewater VoCs across time in different sampling sites. Source data are provided as a Source Data file. a created with BioRender.com released under a CC-BY-NC-ND 4.0 International license.

