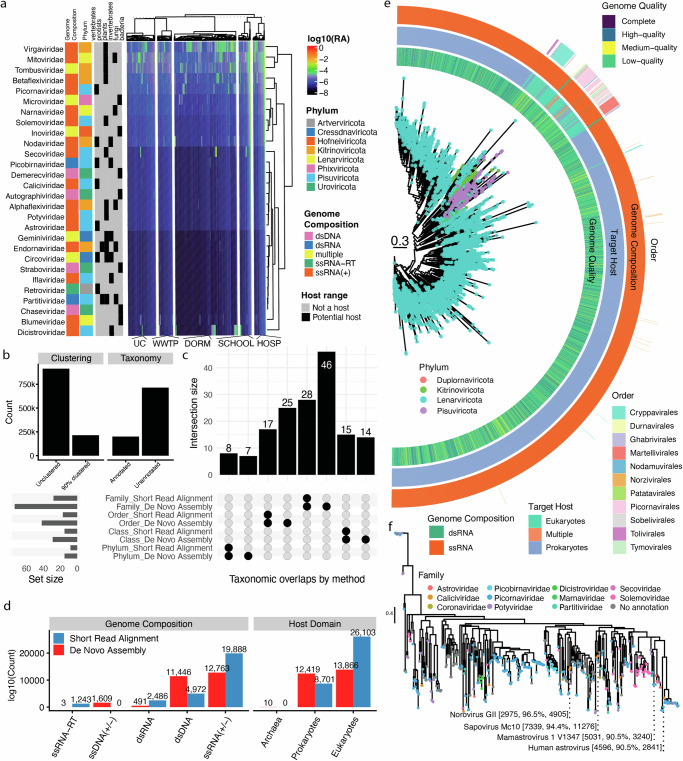
Fig. 4. Wastewater viral phylogenetics and diversity through assembly vs. short-read alignment.
a The relative abundance (RA) of top viral families. Heatmap values are log10(RA) of a given viral family as estimated by short-read alignment. Annotation bars on the left-hand side correspond to the International Committee on Taxonomy of Viruses (ICTV) proposed genome composition, geNomad phylum, and ICTV host range for a given geNomad family-level annotation. Alignments were done to a database of 9 public databases comprising 6 million+ dereplicated, taxonomically annotated, and quality-controlled viral genomes (see “Methods” section). Columns and rows are hierarchically clustered. HOSP hospital, DORM dormitory, SCHOOL primary/secondary school, WWTP wastewater treatment plant, UC university campus. b Left side: The number of putative viral contigs detected by CheckV compared to the number remaining when clustered at 90% nucleic acid identity. Right side: The number of contigs with and without geNomad taxonomic annotations. c The overlap between taxa identified by de novo assembly vs. short-read alignment at different ranks. d The different genome compositions and target host information identified by de novo assembly and short-read alignment. e A maximum likelihood phylogeny of RNA viruses present in our de novo assembled data. Scale bar is indicated on the plot. f A second maximum likelihood phylogeny of RNA viruses present in de novo assembled data annotated as the family Pisuviricota. Species-level annotations derive from BLASTing viruses against the complete RefSeq viral genomes at the 90% identity level. The numbers following the species names indicate the genome length, percent identity to the named reference species, and the bitscore of the alignment. Source data are provided as a Source Data file.

