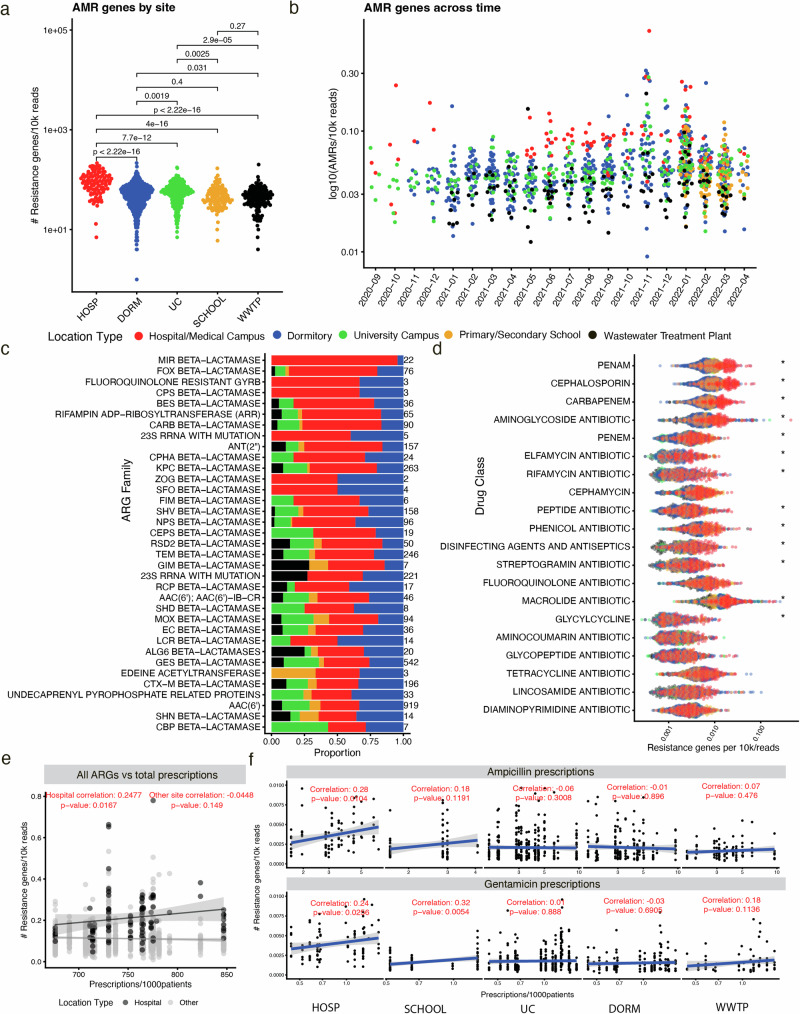
Fig. 5. The antimicrobial resistance landscape of wastewater across time and space.
a The total number of called Antimicrobial Resistance Genes (ARGs) across different sample types per 10 thousand reads, with p-values deriving from t-tests on log10 transformed ARG counts normalized by sequencing depth. HOSP hospital, DORM dormitory, SCHOOL primary/secondary school, WWTP wastewater treatment plant, UC university campus. b The total ARGs identified across time. c The top 25 most prevalent ARGs in hospital wastewater. Color scheme relates to the legend above. d The top specific ARGs for different drug classes across all sample types. Asterisks correspond to if a given ARG was enriched (in terms of log10 observations per 10k reads) in hospital wastewater when compared to all other sites according to the adjusted p-value on a t-test. P-values were adjusted by the Benjamini–Yekutieli procedure. For an asterisk to be present, an antibiotic class must have been enriched in all four comparisons (e.g., hospitals vs dormitories, hospitals vs the university campus, hospitals vs primary schools, and hospitals vs the wastewater treatment plant). e The Pearson correlation between the sum total of all sampled hospital antibiotic prescriptions and the total ARG counts per 10k for hospitals (black) and (all other sites). This color scheme only applies to this panel. Data are presented as a linear regression line (mean values) surrounded by 95% confidence intervals (area shaded in gray). f The same as (e), except the only genes considered in the correlation are those annotated as conferring resistance for the two antibiotics listed. The antibiotic data, similarly, is only for prescriptions of those two antibiotics. Data are presented as a linear regression line (mean values) surrounded by 95% confidence intervals (area shaded in gray). Source data are provided as a Source Data file, and all p-values reported stem from two-sided tests.

