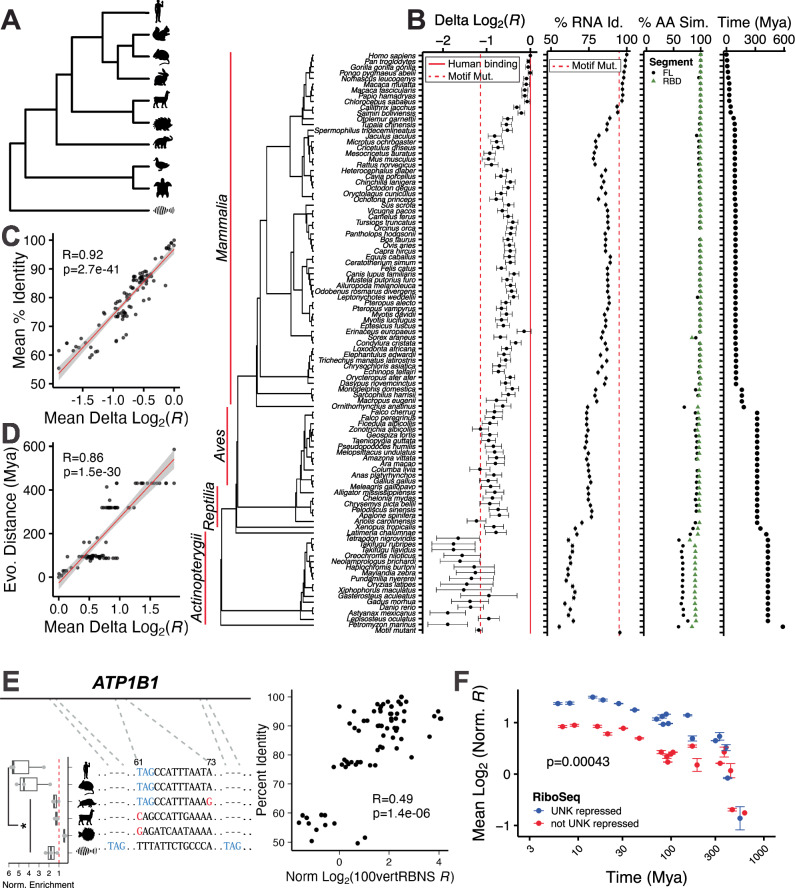
Fig. 5. Evolutionary conservation of binding.
A Simplified tree schematic of vertebrates used for natural sequence RBNS (not all species shown). B Delta log2 100vertRBNS enrichment, percent RNA sequence identity, percent UNK similarity (full length-grey and RBDs-green), and evolutionary distance in millions of years against 100 vertebrates for the aligned sequences from the top human bound oligos. Red dotted line shows average for total motif mutant. Red solid line shows average for human binding. Error bars show standard error of the mean (SEM). C Mean percent RNA sequence identity (Y axis) versus mean delta log2 100vertRBNS enrichment (X axis) for each aligned oligo. Pearson’s correlation coefficient and pval included. Line is presented as mean fit ± SEM. D Evolutionary distance in millions of years (Y axis) versus mean delta log2 100vertRBNS enrichment (X axis) for each aligned oligo. Pearson’s correlation coefficient and pval included. Line is presented as mean fit ± SEM. E (left) Multiple sequence alignment for ATP1B1 for Homo sapiens, Mus musculus, Sus scrofa, Vicugna pacos, Tetradon nigroviridis, and Danio rerio with normalized 100vertRBNS enrichment by species (n = 3). Significance determined via one-sided, paired Wilcoxon tests. Significance marks are as follows: * (p ≤ 0.05). Centre line denotes median (50th percentile) with bounds of box representing 25th to 75th percentiles and the whiskers denoting 5th to 95th percentiles. All data included as individual points. (right) Percent RNA sequence identity (Y axis) versus normalized delta log2 100vertRBNS enrichment (X axis). Pearson’s correlation coefficient and pval included. F Scatter plot of log2 normalized 100vertRBNS enrichment by evolutionary distance. X axis plotted on log10 scale. Error bars show SEM. Data were separated by regulation as determined via RiboSeq where blue reflects UNK repression of translation [higher than average log2 fold change (>−0.9)] and red reflects lack of UNK repression [less than average log2 fold change (<−0.9)]. Significance was determined via a two-sided KS test.

