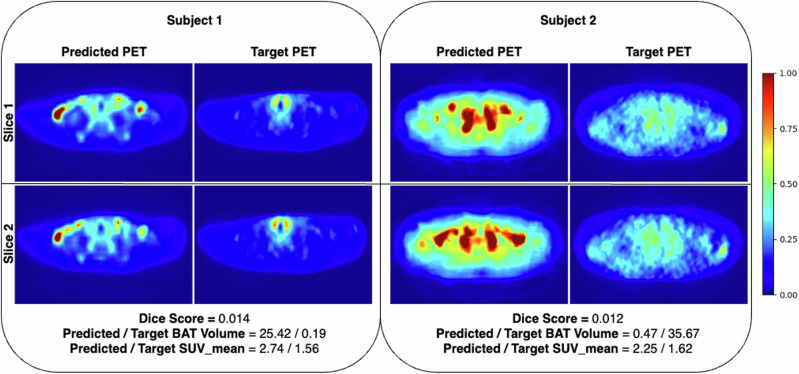
Fig. 7. Visual examples of target and predicted PET scans for the samples with low BAT activity where CNNs make over-predictions in many slices, leading to low quantitative results.
Note that we present examples of two different subjects from the Granada cohort where each row corresponds to a different axial slice of the subjects. In such examples, we observed that CNNs consistently make over-predictions in many slices, possibly due to the bias introduced by the dominance of subjects with high BAT activity in the training set. Note that the images are normalized with respect to the max SUV value in the target PET scans for visualization purposes.

