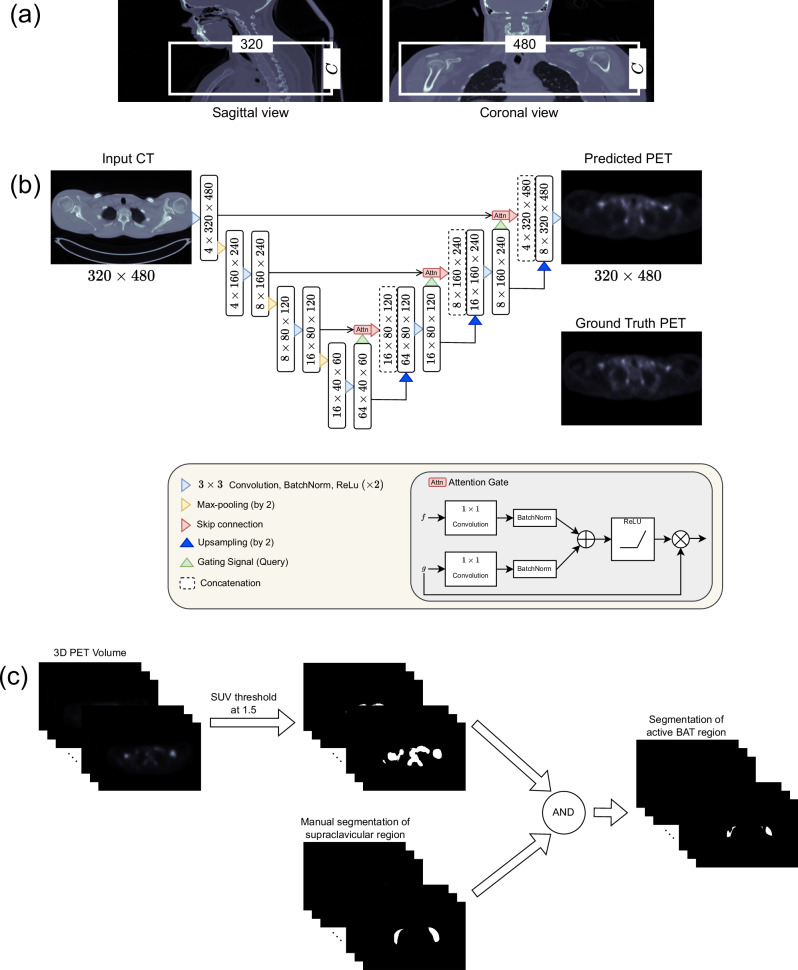
Fig. 8. Illustration of the flow for predicting PET activity of BAT from CT scans and segmenting the active BAT region.
a Illustration of cropping to obtain a region of interest (ROI) that contains the supraclavicular region. Note that C indicates the number of slices in the axial dimension and can slightly change for different subjects. After cropping, the slices are given as input to the CNN shown in (b). b Schematic of the Attention U-Net architecture. c Detecting active BAT regions from a PET volume. Note that “AND" represents the logical and operator that we used to mask out false positive regions obtained after thresholding.

