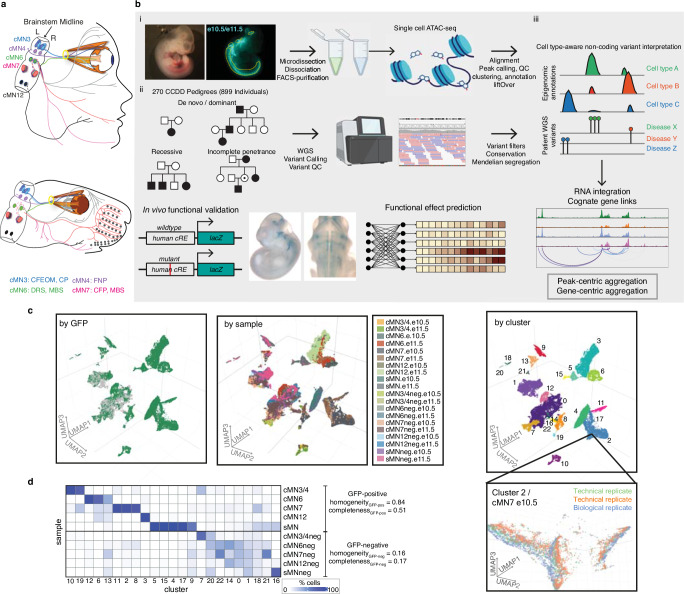
Fig. 1. Integrating Mendelian pedigrees with single-cell epigenomic data.
a Schematic depicting a subset of human (top) and mouse (bottom) cMNs and their targeted muscles. cMN3 (blue) = oculomotor nucleus which innervates the inferior rectus, medial rectus, superior rectus, inferior oblique, and levator palpebrae superior muscles; cMN4 (purple) = trochlear nucleus which innervates the superior oblique muscle; cMN6 (green) = abducens nucleus which innervates the lateral rectus muscle (bisected); cMN7 (pink) = facial nucleus which innervates muscles of facial expression; cMN12 (black) = hypoglossal nucleus which innervates tongue muscles. Corresponding CCDDs for each cMN are listed under the diagram and color coded. CFEOM congenital fibrosis of the extraocular muscles, CP congenital ptosis, FNP fourth nerve palsy. b Overview of the experimental and computational approach. (i) Generating cell type-specific chromatin accessibility profiles. Brightfield and fluorescent images of e10.5 Isl1MN:GFP embryo (left) from which cMNs are microdissected (yellow dotted lines, dissociated, FACS-purified (middle), followed by scATAC and data processing. (ii) WGS of 270 CCDD pedigrees (left; 899 individuals; sporadic and inherited cases) followed by joint variant calling, QC, and Mendelian variant filtering (right). (iii) Integrating genome-wide non-coding variant calls with epigenomic annotations for variant nomination (top). To inform variant interpretation, we identify cognate genes (second row), aggregate candidate variants, generate functional variant effect predictions (third row), and validate top predictions in vivo (bottom). c UMAP embedding of single-cell chromatin accessibility profiles from 86,089 GFP-positive cMNs, sMNs, and their surrounding GFP-negative neuronal tissue colored by GFP reporter status (left, GFP-positive green, GFP-negative gray), sample (middle) and cluster (right). Gridlines in middle UMAP apply to left and right UMAPs as well. The inset shows the relative proximity of Cluster 2 cells dissected from the same cell type (cMN7 e10.5) from different technical and biological replicates. d Heatmap depicting proportions of dissected cells within each of the 23 major clusters. Homogeneity/completeness metrics are shown for GFP-positive versus -negative clusters. Figure 1b was created with BioRender.com and released under a Creative Commons Attribution-NonCommercial-NoDerivs 4.0 International license.

