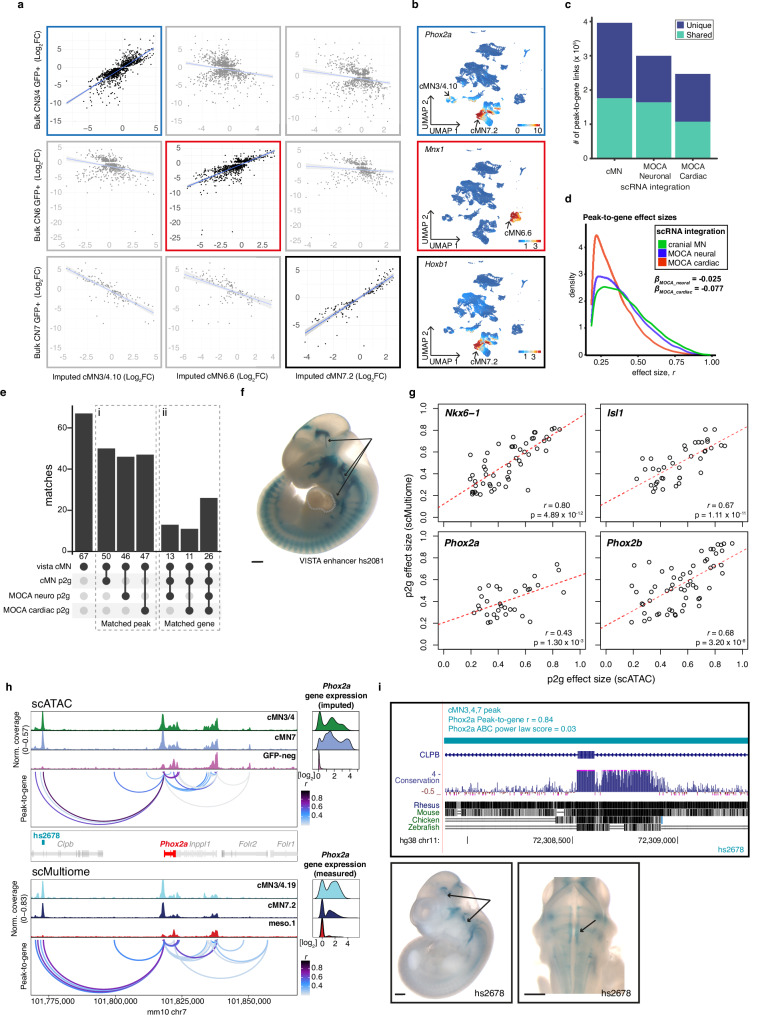
Fig. 3. Effects of RNA input data on peak-to-gene accuracy.
a Imputed gene expression values projected onto scATAC clusters cMN3/4.10, cMN6.6, and cMN7.2 versus measured gene expression values from bulk RNA-seq samples. Error bands represent 95% confidence intervals for each fitted model. b Feature plots depicting imputed gene expression for cMN marker genes Phox2a, Mnx1, and Hoxb1. c Total number of unique and shared peak-to-gene links using different scRNA integration datasets (cMN, MOCA Neuronal, MOCA Cardiac) against the common scATAC cMN peakset. d Distribution of peak-to-gene effect sizes using different scRNA integration datasets. Estimated effect sizes are significantly stronger for cMN scRNA integration relative to MOCA neuro (βMOCA_neuro = −0.077, p < 2 × 10⁻¹⁶, linear regression) and cardiac (βMOCA_cardiac = −0.025, p < 2 × 10⁻¹⁶, linear regression) integrations. e Barplot depicting peak-to-gene elements from different scRNA integrations overlapping experimentally validated cMN enhancers (vista cMN). (i) Matched peak indicates intersect overlapping peaks irrespective of predicted cognate gene. (ii) The matched gene indicates distinct overlapping peaks and identical cognate genes. f In vivo enhancer assay for VISTA enhancer hs2081 (n = 4 embryos) overlapping a predicted peak-to-gene link using cMN versus MOCA cardiac scRNA input. Enhancer activity is positive in cranial nerves 3, 7, and 12 (arrows); negative in heart (dotted lines). g Comparing scATAC versus scMultiome peak-to-gene effect sizes for marker genes Nkx6-1, Isl1, Phox2a, and Phox2b. Linear regression coefficients and nominal p values are shown. h scATAC and scMultiome accessibility profiles with peak-to-gene connections for a 100 kb window centered around Phox2a. hs2678 (n = 5 embryos) is accessible in cMN3/4 and cMN7 and is predicted to enhance Phox2a by scATAC (r = 0.84) and scMultiome (r = 0.69). i (Top) hs2678 is 70.3 kb distal to human PHOX2A and is embedded in the coding and intronic sequence of CLPB. (Bottom) In vivo enhancer assay using human hs2678 (n = 5 embryos) sequence is positive in cMN3 and cMN7 (arrows). Reporter expression views are shown as lateral (left) and dorsal through the fourth ventricle (right). Scale bars in f and i = 500 μm and are approximate measurements based on E11.5 embryo average crown-rump length of 6 mm. Source data are provided as a Source Data file.

