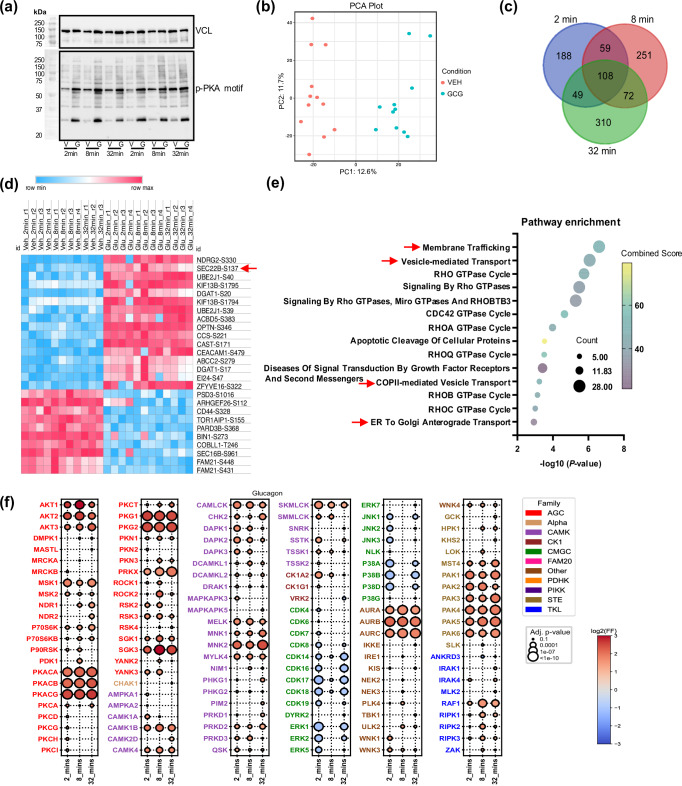
Fig. 1. Glucagon induces rapid and dynamic changes in the liver phosphoproteome.
a Male Sprague Dawley rats were treated with vehicle (V) or glucagon (G) (1.15 nM) for 2, 8 and 32 min (n = 4 rats per group) in situ. Western blot images of liver phospho-protein kinase A (pPKA) motif protein substrates and control vinculin (VCL) were performed. b Principal component analysis (PCA) analysis via the Phospho-Analyst platform from liver samples (using pooled VEH and GCG data sets, n = 11 for VEH and n = 12 for GCG). c VENN diagram of liver phosphoproteomics data from samples as in b (n = 4 rats per group except VEH, 32 min: n = 3). d Heatmap plot of up-regulated (log2 fold change > 4) and down-regulated (log2 fold change < −3) phosphopeptides across all time points from samples as in a (n = 4 rats per group except VEH, 32 min: n = 3). The red arrow indicates SEC22B-S137. Source data are provided as a Source Data file. e Pathway enrichment analysis using EnrichR (Reactome Pathway Database) via the Phospho-Analyst platform (using pooled VEH and GCG data sets, n = 11 for VEH and n = 12 for GCG). EnrichR using Fisher’s exact test and corrected with Benjamini–Hochberg multiple testing. The red arrow indicates the pathway in which SEC22B is involved. f Bubble plot of predicated kinase activation from phosphoproteomics data. Statistical significance was assessed using a one-sided Fisher’s exact test, with p-values adjusted by the Benjamini–Hochberg method. Detailed statistical analysis is provided in the “Phosphoproteomics-Based Kinase Prediction” section of the Methods.

