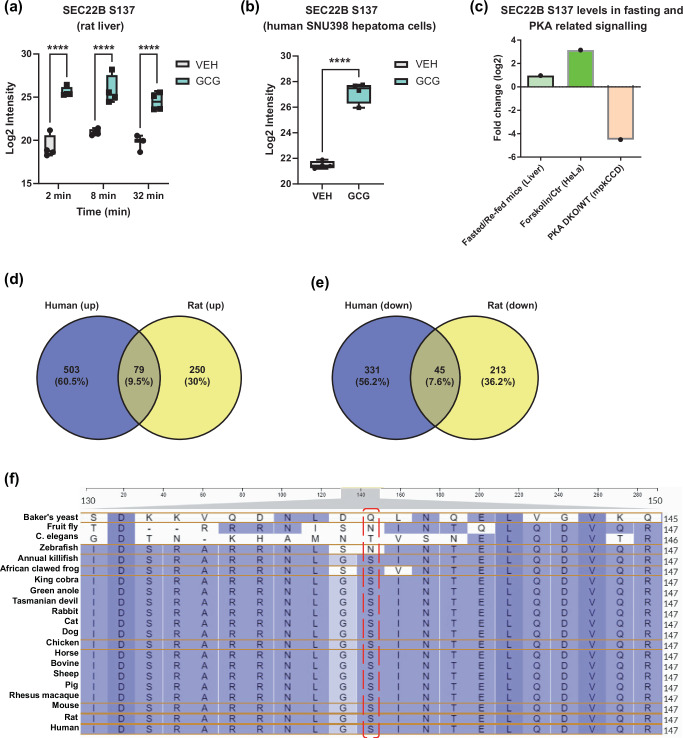
Fig. 2. Glucagon increases SEC22B S137 phosphorylation levels.
a SEC22B S137 phosphorylation levels of male Sprague Dawley rats treated with either vehicle (VEH) or glucagon (GCG) (1.15 nM) for 2, 8 and 32 min (n = 4 rats per group except VEH, 32 min: n = 3) in situ. Statistical tests used were two-way ANOVA with Holm-Sidak post-hoc tests. Difference in treatment: ****P < 0.001. b SEC22B S137 phosphorylation levels of SNU398-GCGR cells treated with either vehicle (VEH) or glucagon (GCG) (1 nM) for 30 min (n = 4 per group). Significance was determined using an unpaired two-tailed Student’s t-test. Difference in treatment: ****P < 0.001. c Data mining of liver SEC22B S137 levels from other phosphoproteomics studies via qPTM database. d–e Venn diagrams shows the overlap of up-regulated (log2 fold change > 1, P value < 0.05) and down-regulated (log2 fold change < −1, P value < 0.05) phospho-proteins (d-e) between rat and human cell lines. f Amino acid residue alignment of phospho-motif sequence SEC22B in different organisms. Source data are provided as a Source Data file. For box plots, data are displayed from the minimum to maximum values, with all individual points shown. The central line represents the median, the box spans the interquartile range (IQR) from the first to third quartile, and the whiskers extend to the smallest and largest values within 1.5 times the IQR from the quartiles (a, b).

