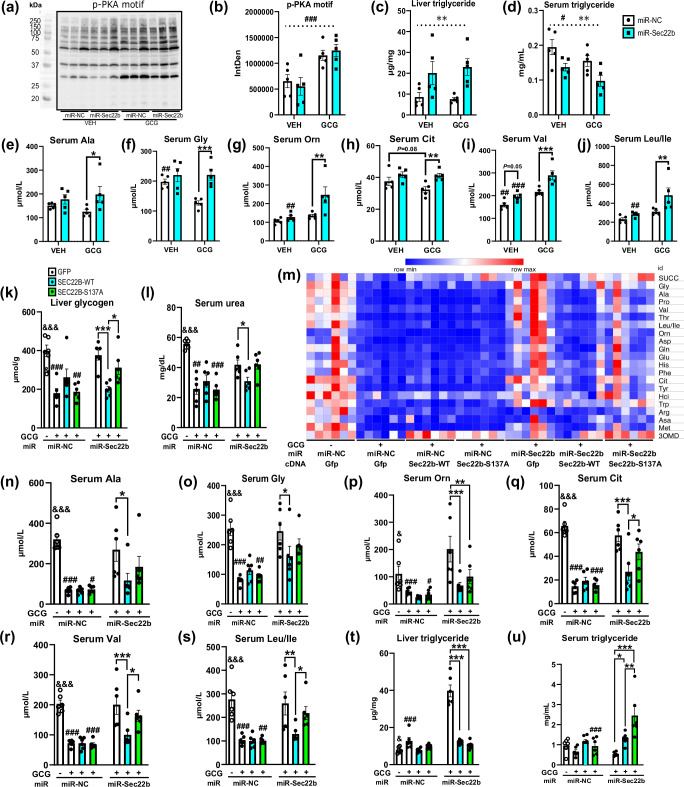
Fig. 4. Hepatic SEC22B-S137 phosphorylation modulates distinct metabolic actions of glucagon.
a Liver western blot images of liver phospho-protein kinase A (pPKA) motif protein substrates and control vinculin (VCL) from male C57Bl/6 N mice administered with adeno-associated viruses expressing a microRNA to silence Sec22b (miR-Sec22b) or a negative control (miR-NC) and fasted for 2 h acutely treated with saline (VEH) or acyl-glucagon (GCG). Images are of 3 individual mice per group. b Western blot quantification of liver phospho-PKA motif protein expression as in a. Samples were obtained from the same experiment, and blots were processed simultaneously. Data are mean ± s.e.m.; n = 5 mice per group. Statistical tests used were 2-way ANOVA with Holm-Sidak post-hoc tests. Dotted line indicates a main effect. Difference between vehicle and glucagon: #P < 0.05, ##P < 0.01, ###P < 0.001; Difference between miR-NC and miR-Sec22b: *P < 0.05, **P < 0.01, ***P < 0.001. c Liver triglyceride levels of mice as in b. d Serum triglyceride levels of mice as in b. e–j Select serum amino acid levels of mice as in b. k Liver glycogen levels of male C57Bl/6 N mice administered with adeno-associated viruses expressing a microRNA to silence Sec22b (miR-Sec22b) or a negative control (miR-NC), and/or AAV-Sec22b wildype (WT) or S137A mutant (S137A) cDNA (Sec22b) or a control (GFP) and treated with either saline (VEH) or acyl-glucagon (GCG) chronically for 2 wk. Data are mean ± s.e.m.; n = 6 mice per group. Statistical tests used include unpaired two-tailed Student T-test (for miR-NC&GFP&VEH and miR-NC&GFP&GCG) and 2-way ANOVA (for all the glucagon treated groups) with Holm-Sidak post-hoc tests. Difference between vehicle and glucagon: &P<0.05, &&P < 0.01, &&&P < 0.001; Difference between miR-NC and miR-Sec22b: #P < 0.05, ##P < 0.01, ###P < 0.001; Difference in GFP, SEC22B-WT and SEC22B-S137A: *P < 0.05, **P < 0.01, ***P < 0.001. l Serum urea levels of mice as in k. m A heatmap of serum amino acid species of mice as in k. Abbreviations for serum amino acids are provided in Supplementary Data 5. n–s Selected amino acid levels of mice as in k. t Liver triglyceride levels of mice as in k. u Serum triglyceride levels of mice as in k. Source data are provided as a Source Data file. Exact P-values are provided in Supplementary Data 6.

