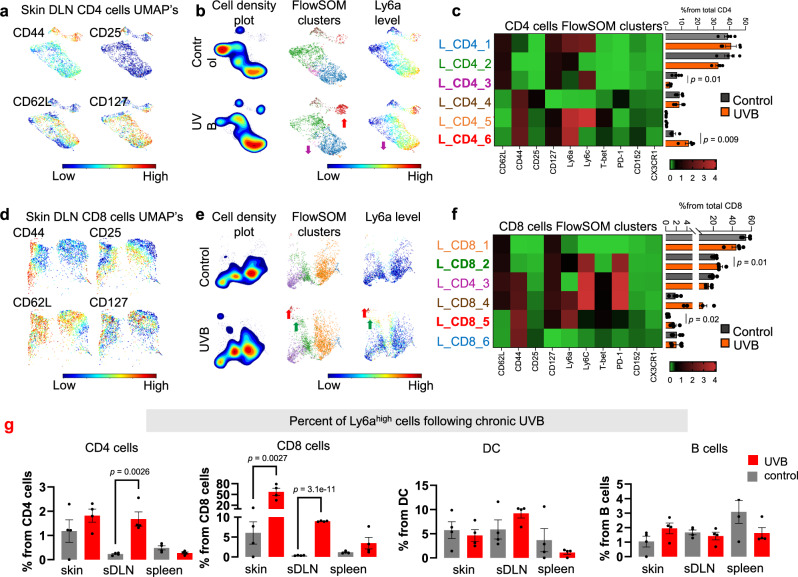
Fig. 2. UVB induces a Ly6ahigh T cell subpopulation in the skin drain lymph nodes.
a Representative UMAPs for CD4+ subset markers levels (red, high; blue, low) in sDLNs (skin Drained Lymph Nodes) of UVB- or mock-irradiated mice (n = 4 per condition). b Cell density plots (left), FlowSOM clusters indicated by different colors (middle), and Ly6a levels (red, high; blue, low) in CD4+ clusters from sDLNs of UVB- or mock-irradiated mice. Arrows, colored by cluster, indicate significantly higher or lower levels in UVB-irradiated versus mock-irradiated mice (n = 4 per condition). c Left: Heatmap of median expression levels of the indicated markers in CD4+ clusters of sDLNs. Colors reflect the transformed ratio relative to the minimum expression of the indicated marker in CD4+ cells. Right: Percentage of each cluster from the total population of CD4+ cells (n = 4 per condition). d–f Analyzes for sDLNs CD8+ cells analysis as done for CD4+ T cells in (a–c). g Mean percent of Ly6ahigh cells in various organs from UVB- and mock-treated mice (n = 4 per group). Statistical significance was determined in a two-tailed t test. n.s. not significant. Error bars represent standard errors. Source data are provided as a Source Data file.

