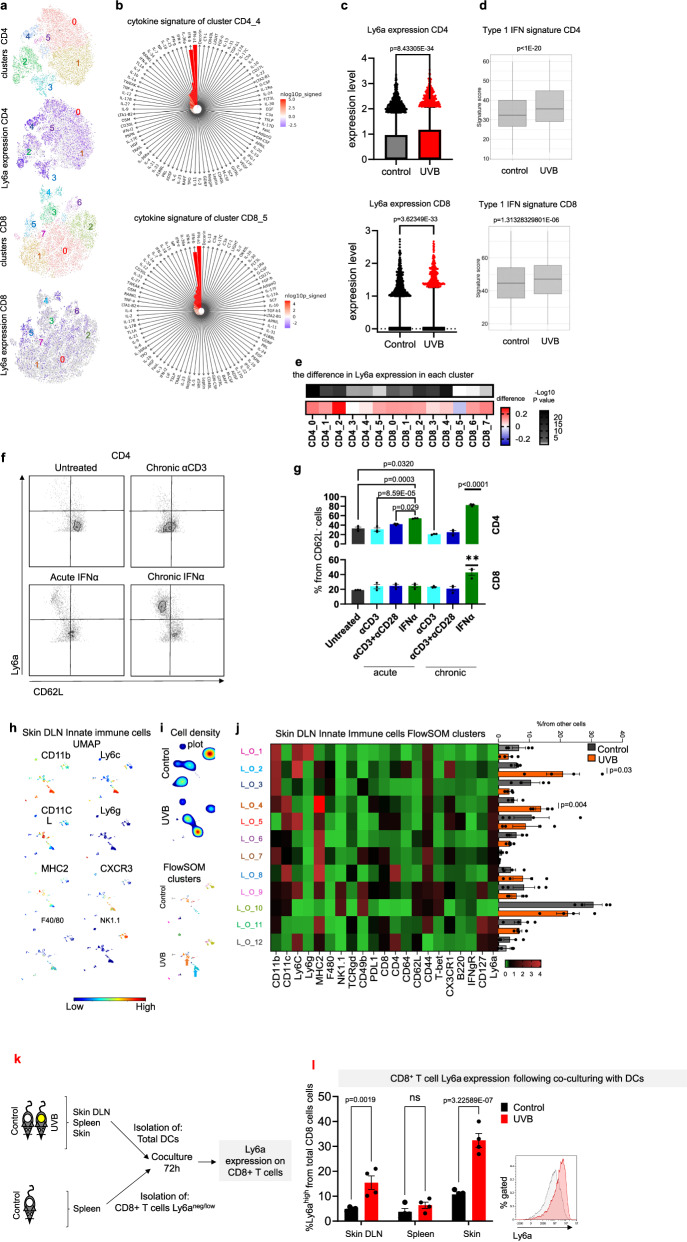
Fig. 3. Ly6ahigh T cells are induced by type 1 IFN secreted by DCs following UVB.
a–e Single-cell RNA-seq analyzes of sDLNs isolated from UVB- and mock-irradiated (control) mice (n = 3 and n = 4, respectively). a t-SNE projection of all 14,783 CD4+ T cells (upper panel) and all 14,020 CD8+ T cells (lower panel) with subsets indicated by colors and numbers, accompanied by t-SNE projections colored by the expression levels of Ly6a (purple) in each cell. b Prediction of the active cytokines within the clusters that express high levels of Ly6a (CD4_4- upper panel; and CD8_5- lower panel). Red indicates a significant level of the activation signature. c Box plot (box represents percentile 25–75 and the median and whiskers represent the range between 10–90; points above the whiskers are drawn as individual points) of Ly6a expression in CD4+ T cells (upper) and CD8+ T cells (lower) following chronic UVB or mock irradiation (control) treatments. d Box plots (box represents percentile 25–75 and the median and whiskers represent the range between minima and maxima) of type 1 IFN signature of CD4+ T cells (upper) and CD8+ T cells (lower) following chronic UVB or mock irradiation (control) treatment. e Heatmap of difference (and significance level in Ly6a expression in UVB-treated mice versus mock-irradiated controls in each cluster of CD4+ and CD8+ T cells. f Representative flow cytometry images of Ly6a expression in splenic T cells activated ex vivo as indicated. g Mean percentages of Ly6a expression in splenic T cells activated ex vivo as indicated (n = 3 per condition). h Representative UMAP plots of non-T and non-B cells in sDLNs (skin Drained Lymph Nodes) from UVB- or mock-irradiated (control) mice (n = 4 per condition). i FlowSOM clusters in sDLNs from UVB- or mock-irradiated (control) mice (n = 4 per condition). j Left: Heatmap of median expression levels of the indicated markers in clusters of sDLNs. Colors reflect the transformed ratio relative to the minimum expression of the indicated marker in CD4+ cells. Right: Percentage of each cluster from the total innate cell population (n = 4 per condition). k Experimental flowchart. l Mean percentages of Ly6a levels in Ly6aneg/low/CD4+ cells after 72 h of co-culture with spleen or sDLN CD11b+ cells from UVB irradiated mice (n = 4 mice per group). Statistical significance was determined by two-tailed t test (c–e, h, i, j, l) or one-way ANOVA test with Tukey correction (g). n.s. not significant. Error bars represent standard errors. Source data are provided as a Source Data file.

