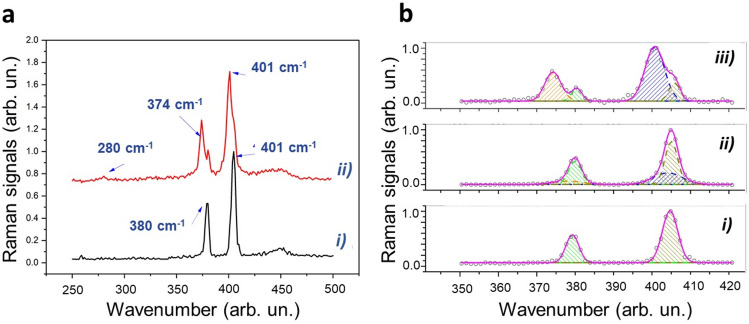
Figure 6.
Characteristic Raman spectra of exfoliated treated and not treated MoS2 NSs. (a) Comparison of selected Raman spectra obtained for not irradiated (trace i) and irradiated (trace ii) flakes. (b) Outcomes of the fitting procedure of 2D-MoS2 bands in the 350–420 cm−1 spectral region. In particular, panel (i) corresponds to the spectrum from untreated flakes, while panel (ii) and (iii) correspond to spectra obtained from irradiated flakes acquired in the inner areas of the flakes (panel ii) and near the border (panel iii). In all the cases, the solid pink lines correspond to the fitted curves, while dashed areas highlight the contribution of the different peaks.

