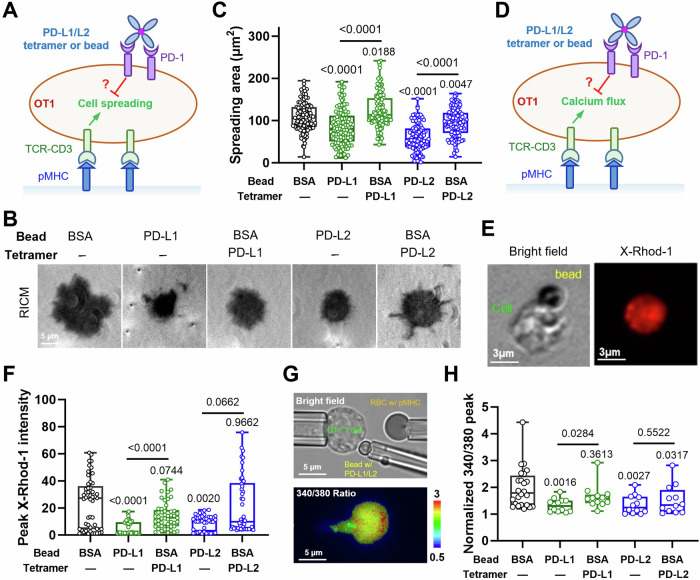
Fig. 2. The inhibitory function of PD-1 on activated primary T cells is enhanced by mechanical support of PD-Ligands.
A Schematics of measuring the suppression of pMHC (SIINFEKL:H2-Kb)-mediated OT1 T cell spreading by soluble PD-Ligand tetramer or PD-Ligand-coated beads. B Representative reflection interference contrast microscopy (RICM) images of an activated OT1 T cell spreading on glass surface functionalized with SIINFEKL:H2-Kb under indicated conditions. C Quantification of cell spreading area for conditions in (B). n = 114, 111, 115, 116, and 114 cells pooled from 2 independent experiments. D Schematics of measuring the suppression of pMHC (SIINFEKL:H2-Kb)-mediated OT1 T cell calcium flux by soluble PD-Ligand tetramer or PD-Ligand-coated beads. E Representative bright-field and X-Rhod-1 images of SIINFEKL:H2-Kb surface stimulation of an OT1 T cell bound to PD-L1-coated beads. F Quantification of peak X-Rhod-1 fluorescence under indicated conditions for experiments illustrated in (D, E). n = 49, 49, 49, 38, and 49 cells. G Representative bright-field (upper) and Fura-2 340/380 radiometric pseudocolor (lower) images illustrating measurement of the suppression of pMHC (SIINFEKL:H2-Kb)-mediated OT1 T cell calcium flux by soluble PD-Ligand tetramer or PD-Ligand-coated beads using a fluorescence micropipette adhesion frequency (fMAF) setup using three micropipettes. See also Movie S1. H Quantification of peak Fura-2 340/380 ratios under indicated conditions for experiments illustrated in (G). n = 24, 12, 12, 12, and 12 T cell-RBC pairs pooled from 2 independent experiments. Data were presented in box (median with 25%/75% boundaries) and whisker (min and max) plots. Numbers on graphs represent p values calculated from two-tailed Mann–Whitney U test of indicated two groups or the experiment group (green or blue) with BSA control (black). Source data are provided in Source Data file.

