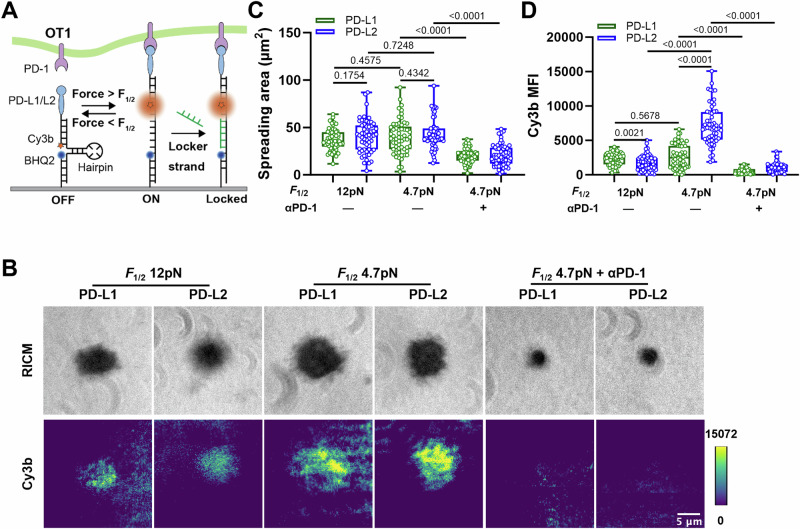
Fig. 3. DNA-based MTPs reveal OT1 T cells applying forces to PD-1–PD-Ligand bonds.
A Schematics of visualizing endogenous forces on PD-1–PD-Ligand bonds using DNA-based molecular tension probes (MTPs). Forces above the force threshold unfold the hairpin to separate Cy3B from the BHQ2, which de-quenches the fluorophore. A complementary single stranded DNA (locker) in solution hybridizes with the unfolded hairpin to lock it in the open configuration, which enables accumulation of the fluorescence signals over time. B Representative reflection interference contrast microscopy (RICM) and total internal reflection fluorescence (TIRF) images of activated OT1 T cells interacting with glass surface functionalized with MTPs of indicated conditions. For PD-1 blockade, cells were pre-incubated with PD-1 blocking antibody clone 29 F.1A12 before imaging. Quantification of cell spreading area (C) and Cy3b fluorescence (D) for conditions in (B). n = 57, 59, 58, 57, 60, and 58 pooled from 1 in 3 independent experiments. Data were presented in box (median with 25%/75% boundaries) and whisker (min and max) plots. Numbers on graphs represent p values calculated from two-tailed Mann–Whitney U test. Source data are provided in Source Data file.

