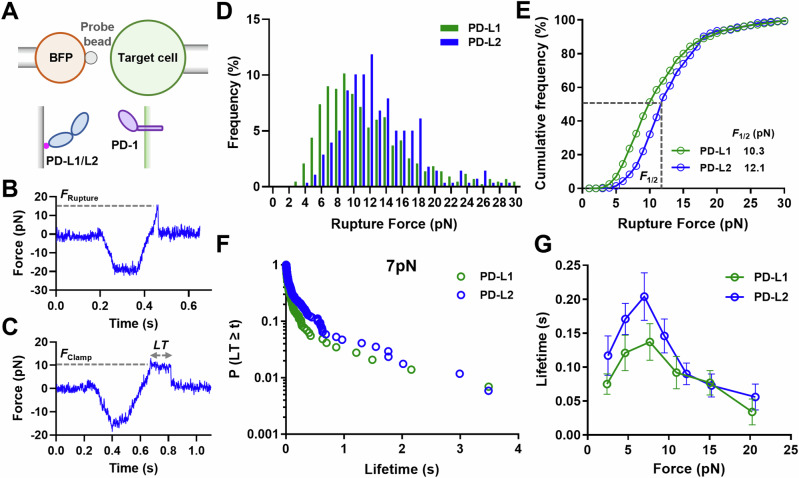
Fig. 4. PD-1 forms catch bond with PD-L1 and PD-L2.
A Schematics of force spectroscopic analysis of PD-1–PD-Ligand bonds using biomembrane force probe (BFP). CHO cells expressing PD-1 were analyzed against BFP bead coated with PD-L1 or PD-L2. Bead displacements were tracked with high spatiotemporal resolution and translated into force after multiplying by the spring constant of BFP. Representative raw traces of rupture force (B) and bond lifetime (C) measurements. A target cell held by piezo-driven micropipette was brought into brief contact with a bead (approach and contact) to allow for bond formation. Upon separation the target cell either kept retracting to rupture the bond (B) or stopped and held at a predefined force level until bond dissociated spontaneously (C). Force histograms (D) and cumulative frequencies (E) of rupture events of 433 PD-1–PD-L1 and 278 PD-1–PD-L2 bonds. F1/2 is defined as the force level at which 50% of the bonds are ruptured. p < 0.0001 comparing F1/2 of PD-1–PD-L1 and PD-1–PD-L2 using two-tailed Mann–Whitney test. Survival frequencies at the 7 pN force bin (F) and mean ± sem bond lifetime vs force plots (G) of PD-1–PD-L1 (n = 55, 129, 144, 120, 33, and 16 lifetime events) and PD-1–PD-L2 (n = 29, 165, 170, 173, 105, 82, and 53 lifetime events) bonds. p < 0.0001 comparing lifetime vs force distributions of PD-1–PD-L1 and PD-1–PD-L2 using two-tailed two-dimensional Kolmogorov-Smirnov test. Source data are provided in Source Data file.

