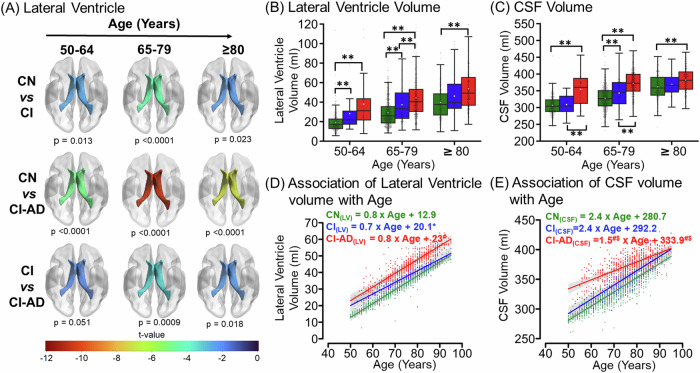
Fig. 3. Lateral Ventricular hypertrophy and CSF increase with age across CN, CI, and CI-AD subjects.
A The t-map illustrating the difference of Lateral ventricle volume between CN vs CI, CN vs CI-AD, and CI vs CI-AD across three age groups i.e., 50–64 (early) (CN = 300, CI = 29, and CI-AD = 58), 65–70 (intermediate) (CN = 560, CI = 107, and CI-AD = 314), and ≥80 (late) (CN = 222, CI = 61, and CI-AD = 216). The lower the t value, the higher the difference in the lateral ventricle volume between the cognitive groups. The t-value significance was set at p < 0.017 (Bonferroni corrected) and the color bar depicts the t value. Early enlargement of the ventricles was observed for CI and CI-AD groups compared to the CN. B, C Lateral Ventricle and CSF volume of CN, CI, and CI-AD subjects across early, intermediate, and late age groups respectively. P values were calculated with the unpaired, two-tailed Welch’s t test followed by Bonferroni correction. Statistical significance for comparing the mean lateral ventricle and CSF volume among cognitive groups (CN, CI, and CI-AD) across the stratified age groups was depicted as *p < 0.017, **p < 0.001. D, E LME model regression analysis of Lateral ventricle volume and CSF shows a progressive increase in the volume across three cognitive groups- CN (green), CI (blue), and CI-AD (red). The LME analysis was performed upon setting up the age intercept at 50 years. Statistical significance for the slope and intercept comparison between CN vs CI (*), CN vs CI-AD (#), and CI vs CI-AD ($) was set at p < 0.05.

