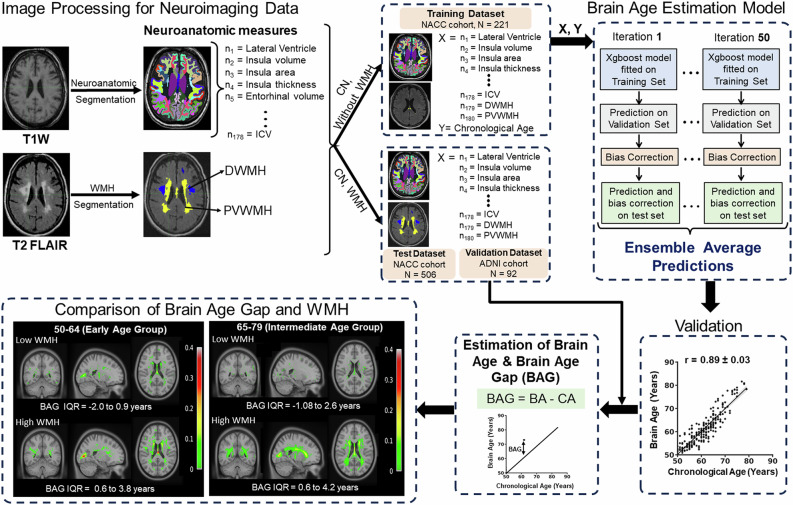
Fig. 6. Brain age (BA) model developed from 180 MRI-obtained neuroanatomical volumetry and white matter hyperintensity load.
Schematics illustrating the workflow of the Brain Age estimation model. The T1 and T2-FLAIR MR images from CN subjects were segmented to obtain 178 neuroanatomic measures, PVWMH, and DWMH. The subjects were then divided into training, test, and validation data sets. The neuroanatomic features, PVWM and DWMH of the subjects in the training data set were used as an input together with Chronological Age (CA) to develop the BA model. The model’s performance was validated using the average association between BA and CA, obtained from the average prediction for 50 iterations. BA and Brain Age Gap (BAG) were estimated using the BA model for test and validation data sets. A comparison of BAG and WMH was shown using voxel-wise probability maps, depicting the occurrence of total WMH load (PVWMH + DWMH) on the coronal, sagittal and axial slice for cognitively normal subjects in the early age group with no or low WMH (WMH < 1.5 ml, n = 95) and high WMH (WMH 5–10 ml, n = 32) and intermediate age group with no or low WMH (n = 35) and high WMH (n = 118) with the range of BAG.

