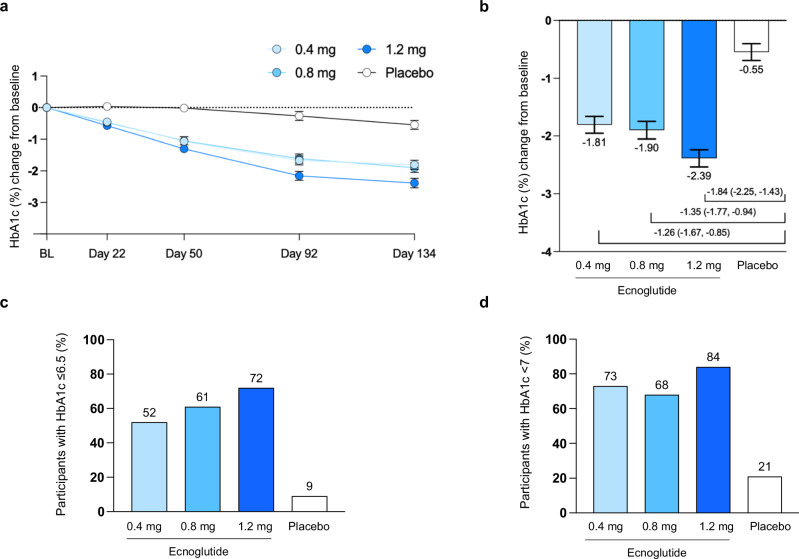
Fig. 2. HbA1c changes from baseline in participants treated with ecnoglutide or placebo.
a HbA1c change from baseline to end of treatment (Day 134), derived from mixed model for repeated measures (MMRM) analysis. Least squares mean and SE are shown. Numbers of participants (n) for the 0.4, 0.8, 1.2 mg ecnoglutide and placebo groups, respectively, are as follows: BL, 37, 36, 36, 36; Day 22, 36, 35, 35, 36; Day 50, 35, 34, 35, 36; Day 92, 35, 34, 33, 34; and Day 134, 33, 31, 32, 33. b HbA1c change from baseline at Day 134 and difference from placebo, derived from MMRM analysis, with n = 33, 31, 32, 33 participants in the 0.4, 0.8, 1.2 mg ecnoglutide and placebo groups, respectively. Least squares mean and SE are shown, as well as mean difference from placebo and 95% confidence interval. All ecnoglutide treatment groups were significantly different from placebo (P < 0.0001) using σ = 0.3 superiority margin. c, d The proportion of participants with HbA1c values of ≤6.5% and <7%, respectively, at Day 134. Intent to treat (ITT) population is shown for all analyses. BL baseline. Source data are provided as a Source Data file.

