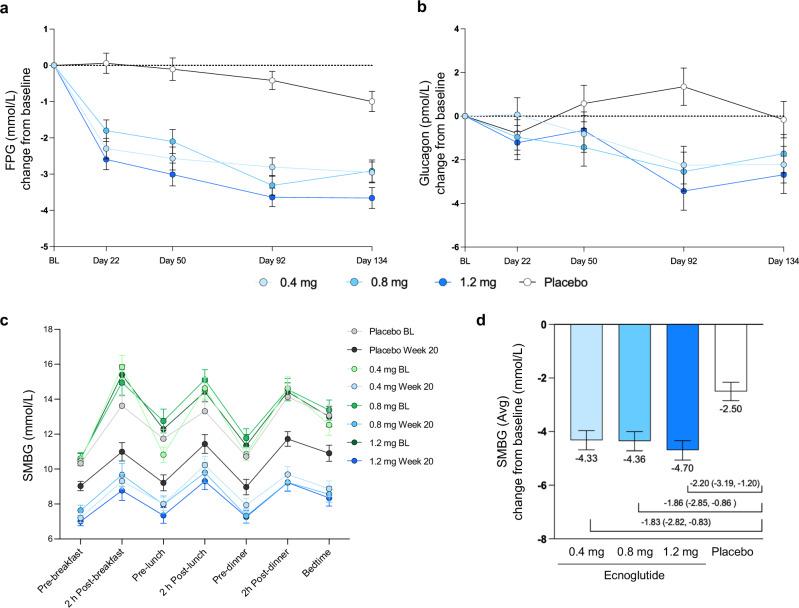
Fig. 3. Changes in glucose and glucagon from baseline.
a Fasting blood glucose (FBG) change from baseline to end of treatment (Day 134), using mixed model for repeated measures (MMRM) analysis. Least squares mean and SE are shown. Numbers of participants (n) for the 0.4, 0.8, 1.2 mg ecnoglutide and placebo groups, respectively, are as follows: BL, 37, 34, 34, 36; Day 22, 36, 35, 35, 36; Day 50, 35, 34, 35, 36; Day 92, 36, 34, 34, 36; and Day 134, 33, 31, 32, 34. P < 0.0001 for all ecnoglutide cohorts compared to placebo at Days 22, 50, 92, and 134. b Glucagon change from baseline to end of treatment (Day 134), using MMRM analysis. Least squares mean and SE are shown. Numbers of participants (n) for the 0.4, 0.8, 1.2 mg ecnoglutide and placebo groups, respectively, are as follows: BL, 37, 36, 36, 36; Day 22, 36, 35, 35, 36; Day 50, 36, 35, 35, 36; Day 92, 36, 34, 34, 36; and Day 134, 34, 31, 32, 34. P < 0.0001 for ecnoglutide 1.2 mg compared to placebo at Day 92. P < 0.002 for ecnoglutide 0.4 and 0.8 mg on Day 92. P < 0.02 for ecnoglutide 1.2 mg on Day 134. c Self-monitored blood glucose pre- and post-meals at baseline and end of treatment (sampled between Days 135–140). Means and SE are shown. d SMBG average change from baseline to Week 20, derived from analysis of variance (one-way ANOVA). Least squares mean and SE are shown, as well as mean difference from placebo and 95% confidence interval. P values were 0.0002, 0.0002, and <0.0001, for 0.4, 0.8, 1.2 mg ecnoglutide compared to placebo, respectively. Numbers of participants (n) for SMBG for the 0.4, 0.8, 1.2 mg ecnoglutide and placebo groups, respectively, are BL, 34, 35, 35, 34; Week 20, 29, 30, 28, 30. BL baseline. Source data are provided as a Source Data file.

