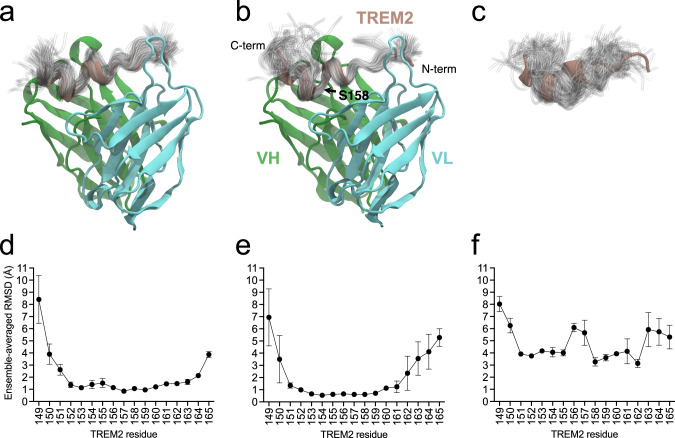
Fig. 7. Ensembles of TREM2 conformations from MD simulations.
Ensembles for (a) hu3.10C2-TREM2 complex, b huPara.09-TREM2 complex, c unbound TREM2. Below, the means and standard deviations of the ensemble-averaged per-residue root-mean-squared deviations (RMSDs, in Å), relative to the crystal structure coordinates, are plotted for each of the n = 3 independent simulation runs of (d) hu3.10C2-bound, e huPara.09-bound, and (f) unbound TREM2. Ensembles depict the instantaneous conformation of TREM2 every 10 ns from individual 1 µs simulations (100 total) for hu3.10C2-bound, huPara.09-bound, and unbound structures aligned to the starting crystal structure conformation. The crystal structures are colored with VH in green, VL in cyan, and TREM2 in brown. Ensembles are shown as transparent tubes tracing the backbone of the peptide. The locations of N- and C-termini of the TREM2 peptide, VH and VL regions and location of residue S158 of TREM2 is noted in panel (b), highlighting that the increased flexibility in huPara.09-bound TREM2 conformations is largely limited to regions C-terminal of the kink between helices in the crystallographic binding mode. Note that the renders and fluctuations in panels (a, b, d, e) reflect alignment of the full co-complex to the variable regions of the respective antibody crystal structures, whereas panels (c, f) reflect best-fit alignments to the hu3.10C2-bound TREM2 peptide crystallographic coordinates. Source data are provided as a Source Data file.

