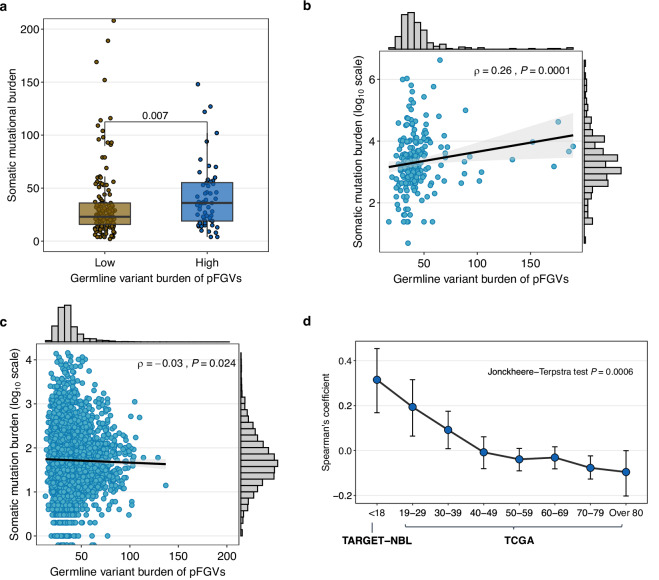
Fig. 2. Correlation between germline variant burden and somatic mutational burden in the TARGET and TCGA.
a Box plot of somatic mutational burden comparing high (above mean, n = 64) vs. low (n = 156) germline variant burden in the TARGET. Boxes represent interquartile ranges with the center line corresponding to the median. The whiskers extend to points within 1.5 times the interquartile range. The statistical analysis was performed using the Wilcoxon rank-sum test. b Correlation between germline variant burden and somatic mutational burden (log-transformed) in the TARGET. c Correlation between germline variant burden and somatic mutational burden (log-transformed) in the TCGA. d Trends in Spearman’s correlation coefficient and confidence intervals between germline variant burden and somatic mutational burden across age groups at diagnosis in the TARGET (white ethnicity, n = 160) and TCGA (n = 7482). For all the scatter plots, the ρ represents Spearman’s correlation coefficient and the black line represents the fitted values from linear regressions, with 95% confidence intervals in gray. Statistical analysis for (a–c) was performed using two-sided tests. The Jonckheere-Terpstra test for (d) was performed with a one-sided alternative hypothesis (less), indicating a decreasing trend. Source data are provided as a Source Data file.

