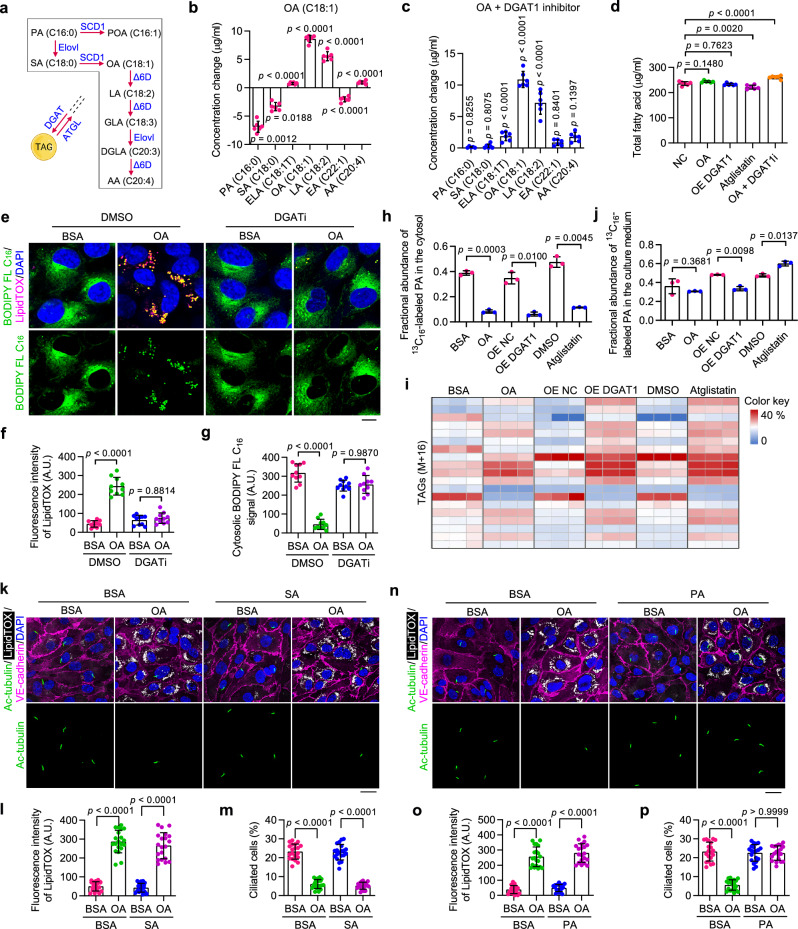
Fig. 3. LD accumulation disrupts ciliary homeostasis by reducing cytosolic PA availability.
a Metabolic pathway of indicated fatty acids. SCD1 stearoyl-CoA desaturase-1, Elovl Elongation of very long-chain fatty acid, Δ6D Δ6 desaturase, PA palmitic acid, POA palmitoleic acid, SA stearic acid, OA oleic acid, LA linoleic acid, GLA gamma-linolenic acid, DGLA dihomo-γ-linolenic acid, AA arachidonic acid. b, c GC-MS analysis showing changes in levels of indicated free fatty acids in HUVECs (n = 6 samples). ELA elaidic acid, EA erucic acid. d GC-MS analysis showing changes in the total free fatty acid level in HUVECs (n = 6 samples). e–g Immunofluorescence images (e) and quantifications of LipidTOX staining (f) and cytosolic BODIPY FL C16 signal (g) of treated HUVECs (n = 10 fields from 3 independent experiments). Scale bar, 5 µm. h–j LC-MS analysis showing the fractional abundance of 13C16-labeled PA in the cytosol (h), 13C16-labeled triglycerides in whole cells (i), and 13C16-labeled PA in the culture medium (j) of HUVECs with the following treatment: OA (200 μM) for 12 h; DGAT1 overexpression for 48 h; or Atglistatin (10 µM) for 24 h (n = 3 samples). HUVECs were pretreated with 13C16-PA (200 μM) for 24 h and rinsed with fresh medium before the above treatments. k–p Immunofluorescence images (k, n) and quantifications of LipidTOX staining (l, o) and ciliation (m, p) of HAECs treated with 200 μM OA and/or 200 μM SA or PA for 12 h (n = 20 fields from 3 independent experiments). Cells were treated with BSA or OA for 12 h, exposed to SA or PA for 12 h, and then serum-starved for 48 h. Scale bars, 20 µm. Data are presented as mean ± SEM. Statistical significance was determined by unpaired two-tailed Student’s t-test (b, c, h, j), one-way (d), or two-way (f, g, l, m, o, and p) ANOVA with post hoc analysis. Source data are provided as a Source Data file.

