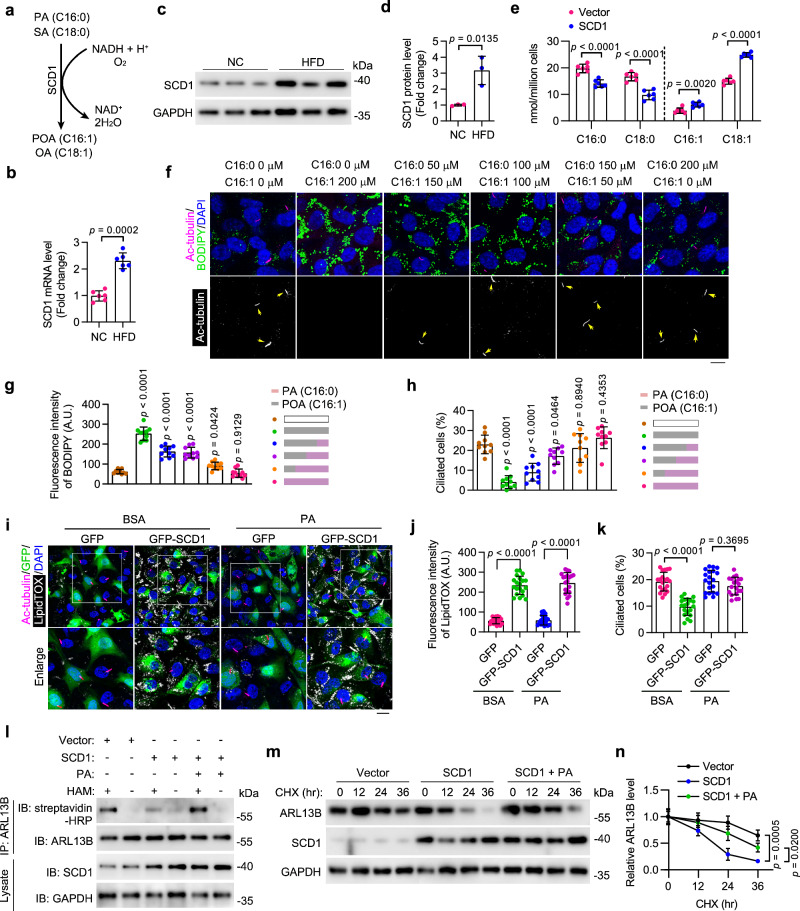
Fig. 5. HFD-stimulated SCD1 disrupts ciliary homeostasis by reducing PA availability.
a Schematic of the reaction catalyzed by SCD1. b The mRNA level of SCD1 in MAECs isolated from ApoEKO mice fed NC or HFD (n = 6 mice). c, d Immunoblotting (c) and quantification (d, n = 3 mice) of the protein level of SCD1 in MAECs isolated from ApoEKO mice fed NC or HFD. e Levels of indicated fatty acids in HUVECs with or without SCD1 overexpression (n = 6 samples). f–h Immunofluorescence images (f) and quantifications of BODIPY staining (g) and ciliation (h) of HUVECs treated with palmitic acid (PA) and palmitoleic acid (POA) at the indicated concentration for 12 h, followed by serum starvation for 48 h (n = 10 fields from 3 independent experiments). Scale bar, 10 µm. i–k Immunofluorescence images (i) and quantifications of LipidTOX staining (j) and ciliation (k) of BSA- or PA (200 µM)-treated HAECs with or without SCD1 overexpression (n = 20 fields from 3 independent experiments). Boxed areas are enlarged in the bottom panel. Scale bar (for enlarged images), 10 µm. l HUVECs with or without SCD1 overexpression were treated with BSA or PA (200 µM) for 12 h. IP-ABE and immunoblotting were performed to determine the level of ARL13B S-palmitoylation. pcDNA3.1 vector was used as the Vector control. m, n HUVECs with or without SCD1 overexpression were treated with or without PA (200 µM) for 12 h. 20 mg/mL cycloheximide (CHX) was then added for the indicated time. The levels of ARL13B and SCD1 were examined by immunoblotting (m) and quantified by densitometry (n) (n = 3 samples). Data are presented as mean ± SEM. Statistical significance was determined by unpaired two-tailed Student’s t-test (b, d, and e), one-way (g, h, n), or two-way (j, k) ANOVA with post hoc analysis. Source data are provided as a Source Data file.

