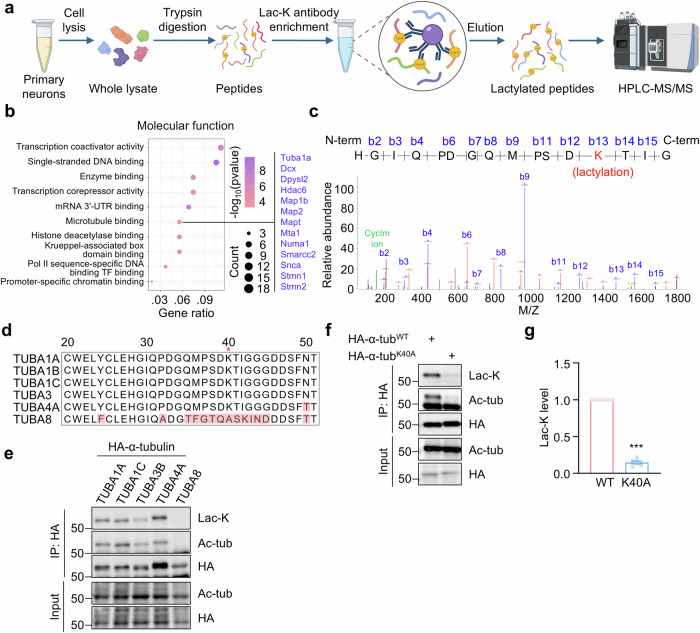
Fig. 1. Identification of α-tubulin lactylation on K40.
a Schematic diagram of purification and proteomic analysis of lactylated peptides from cultured neurons. b Top 10 significantly enriched molecular function of lactylated proteins. Two-sided Fisher’s Exact Test, p < 0.05. c Mass spectrometry analysis showing lactylation at K40 on α-tubulin from cultured cortical neurons. Expected molecular weights of lactylated peptides from N terminus and C terminus are shown as peaks in red and blue, respectively. The CycIm ion at m/z 156.103 is shown as a peak in green. d Shown are amino acid sequences of tubulins encoded by different genes, including TUBA1A, TUBA1B, TUBA1C, TUBA3, TUBA4A, and TUBA8. The variant amino acids are indicated in red. e Lactylation of α-tubulin encoded by different genes. HEK293T cells were transfected with HA-tagged α-tubulins encoded by indicated tubulin genes. HA-α-tubulin was purified by immunoprecipitation with anti-HA antibody and α-tubulin lactylation was revealed by anti-Lac-K antibody. n = 3 experiments. f Abolished α-tubulin lactylation in K40A mutant. HEK293T cells were transfected with HA-tagged α-tubulin or α-tubulin K40A mutant. g Quantification analysis of data in (f). n = 6 experiments. Two-sided paired student’s t-test, p < 0.0001. Data are shown as mean ± SEM. ***p < 0.001. Source data are provided as a Source Data file.

